A Matrix
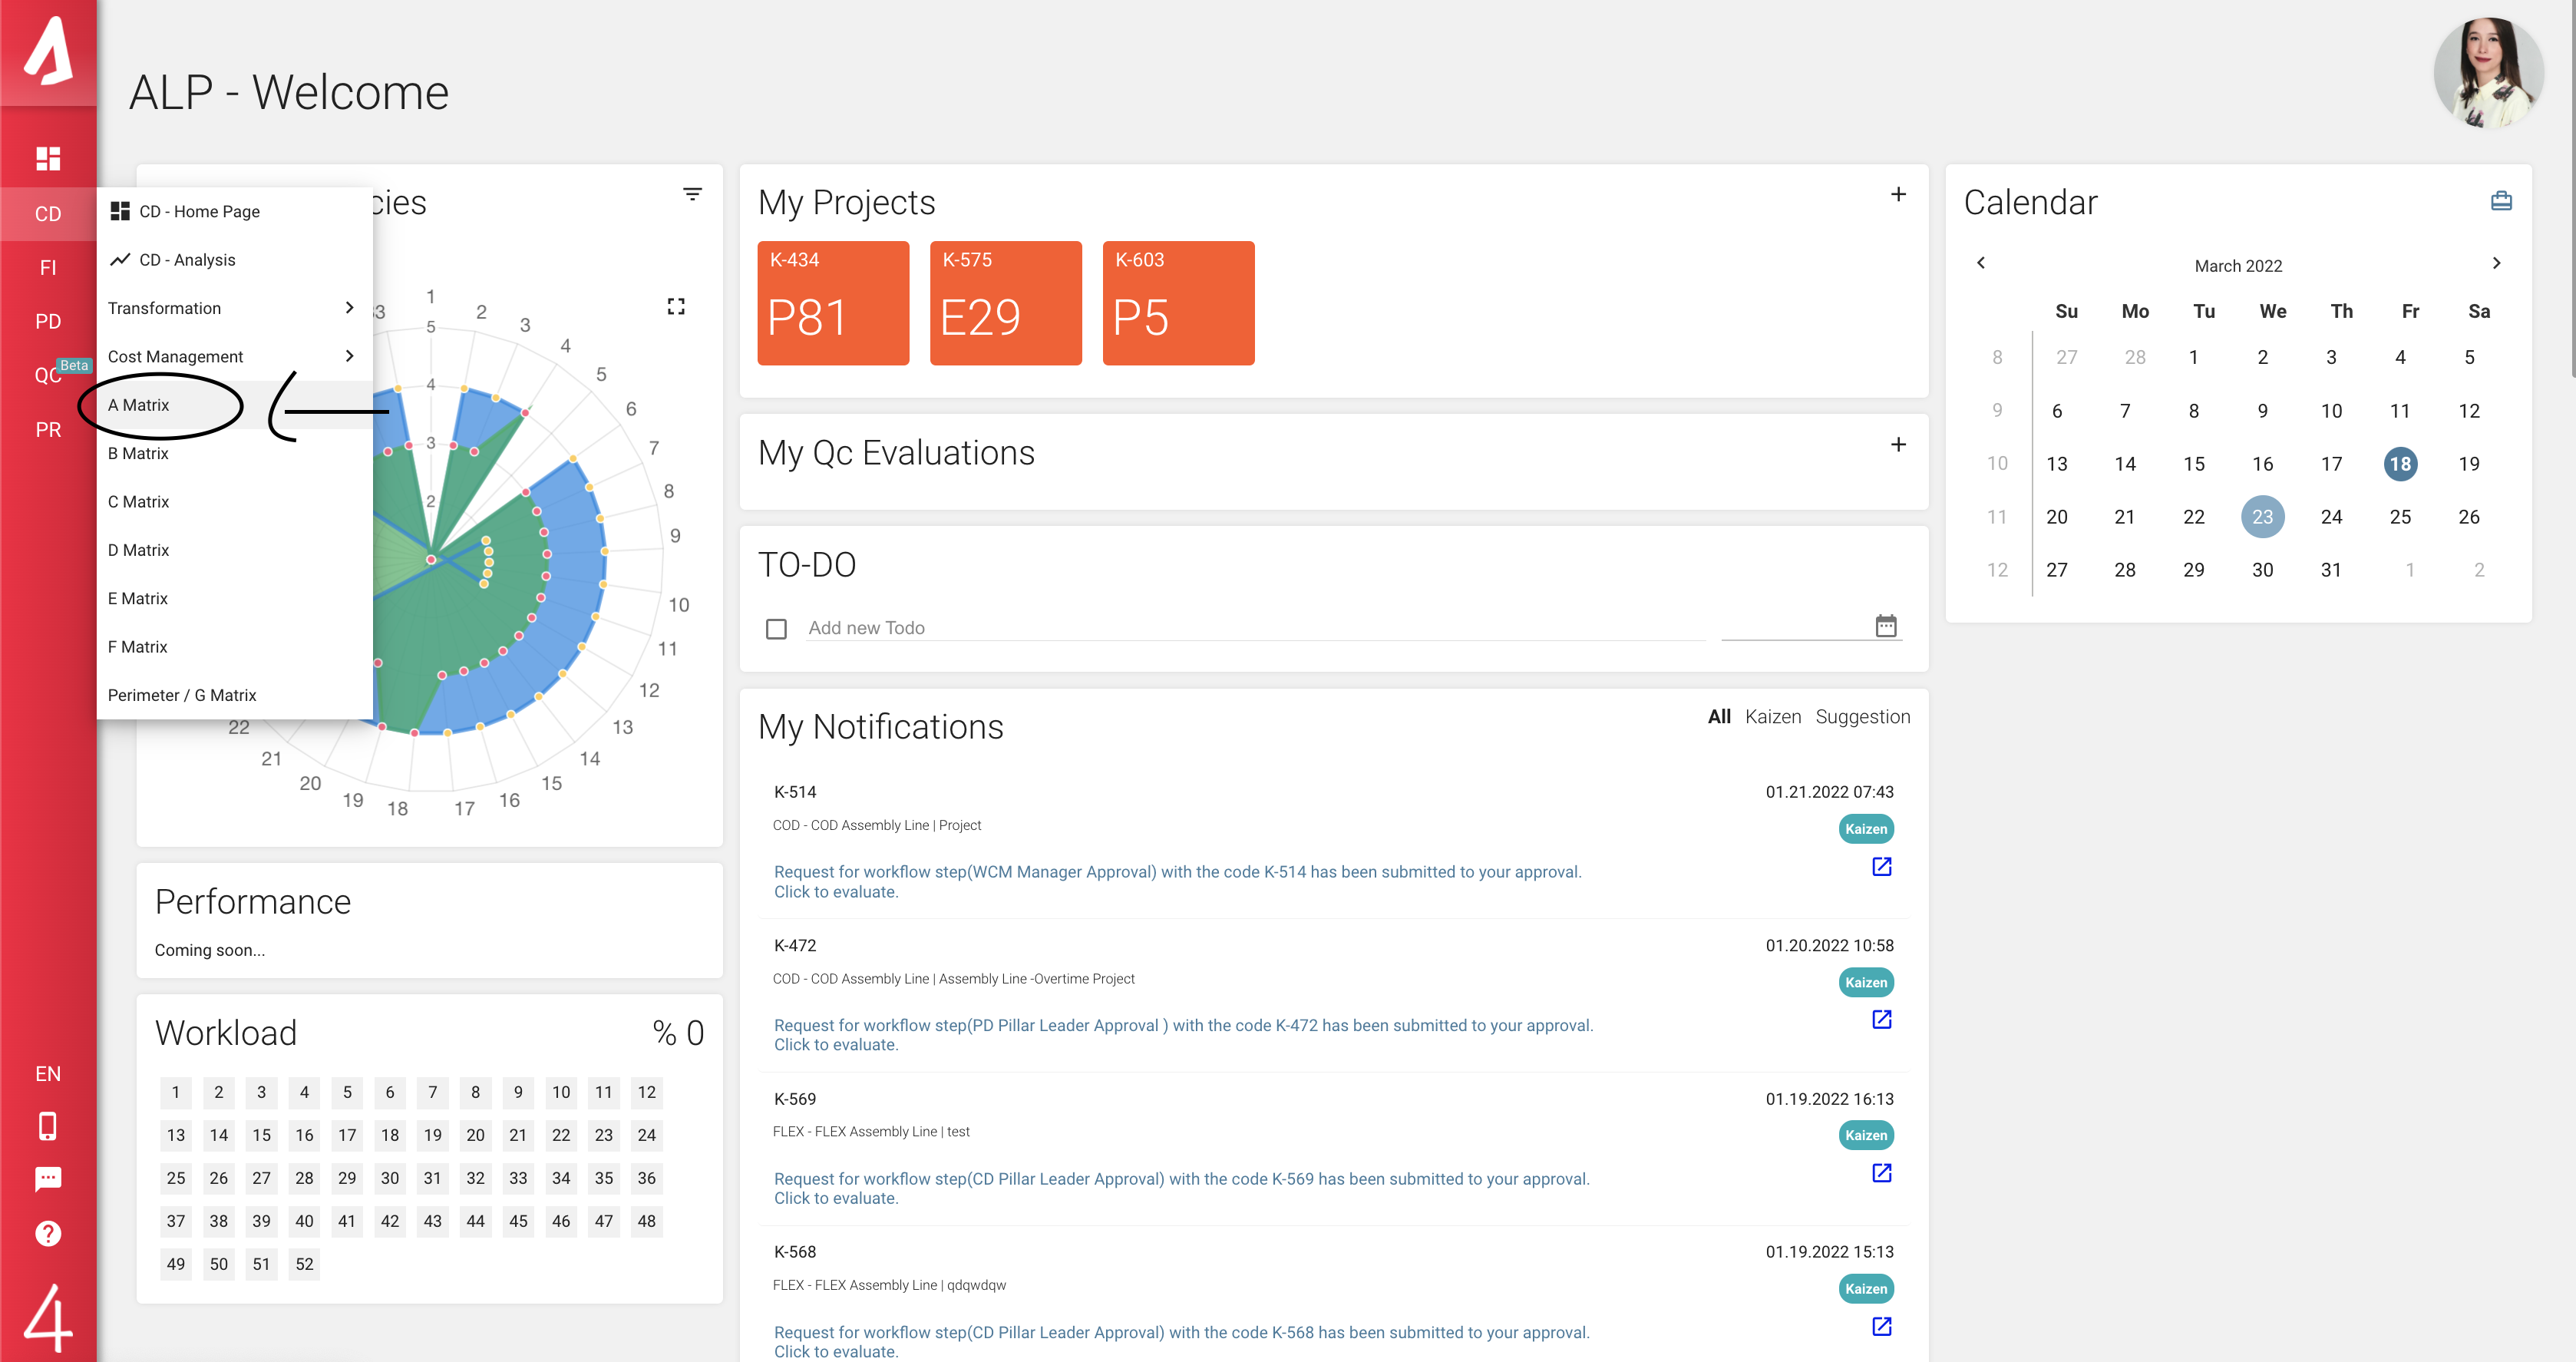
When a new loss has been detected, A Matrix is the section to record it. On the left side of the screen, you can select A Matrix under the CD menu.
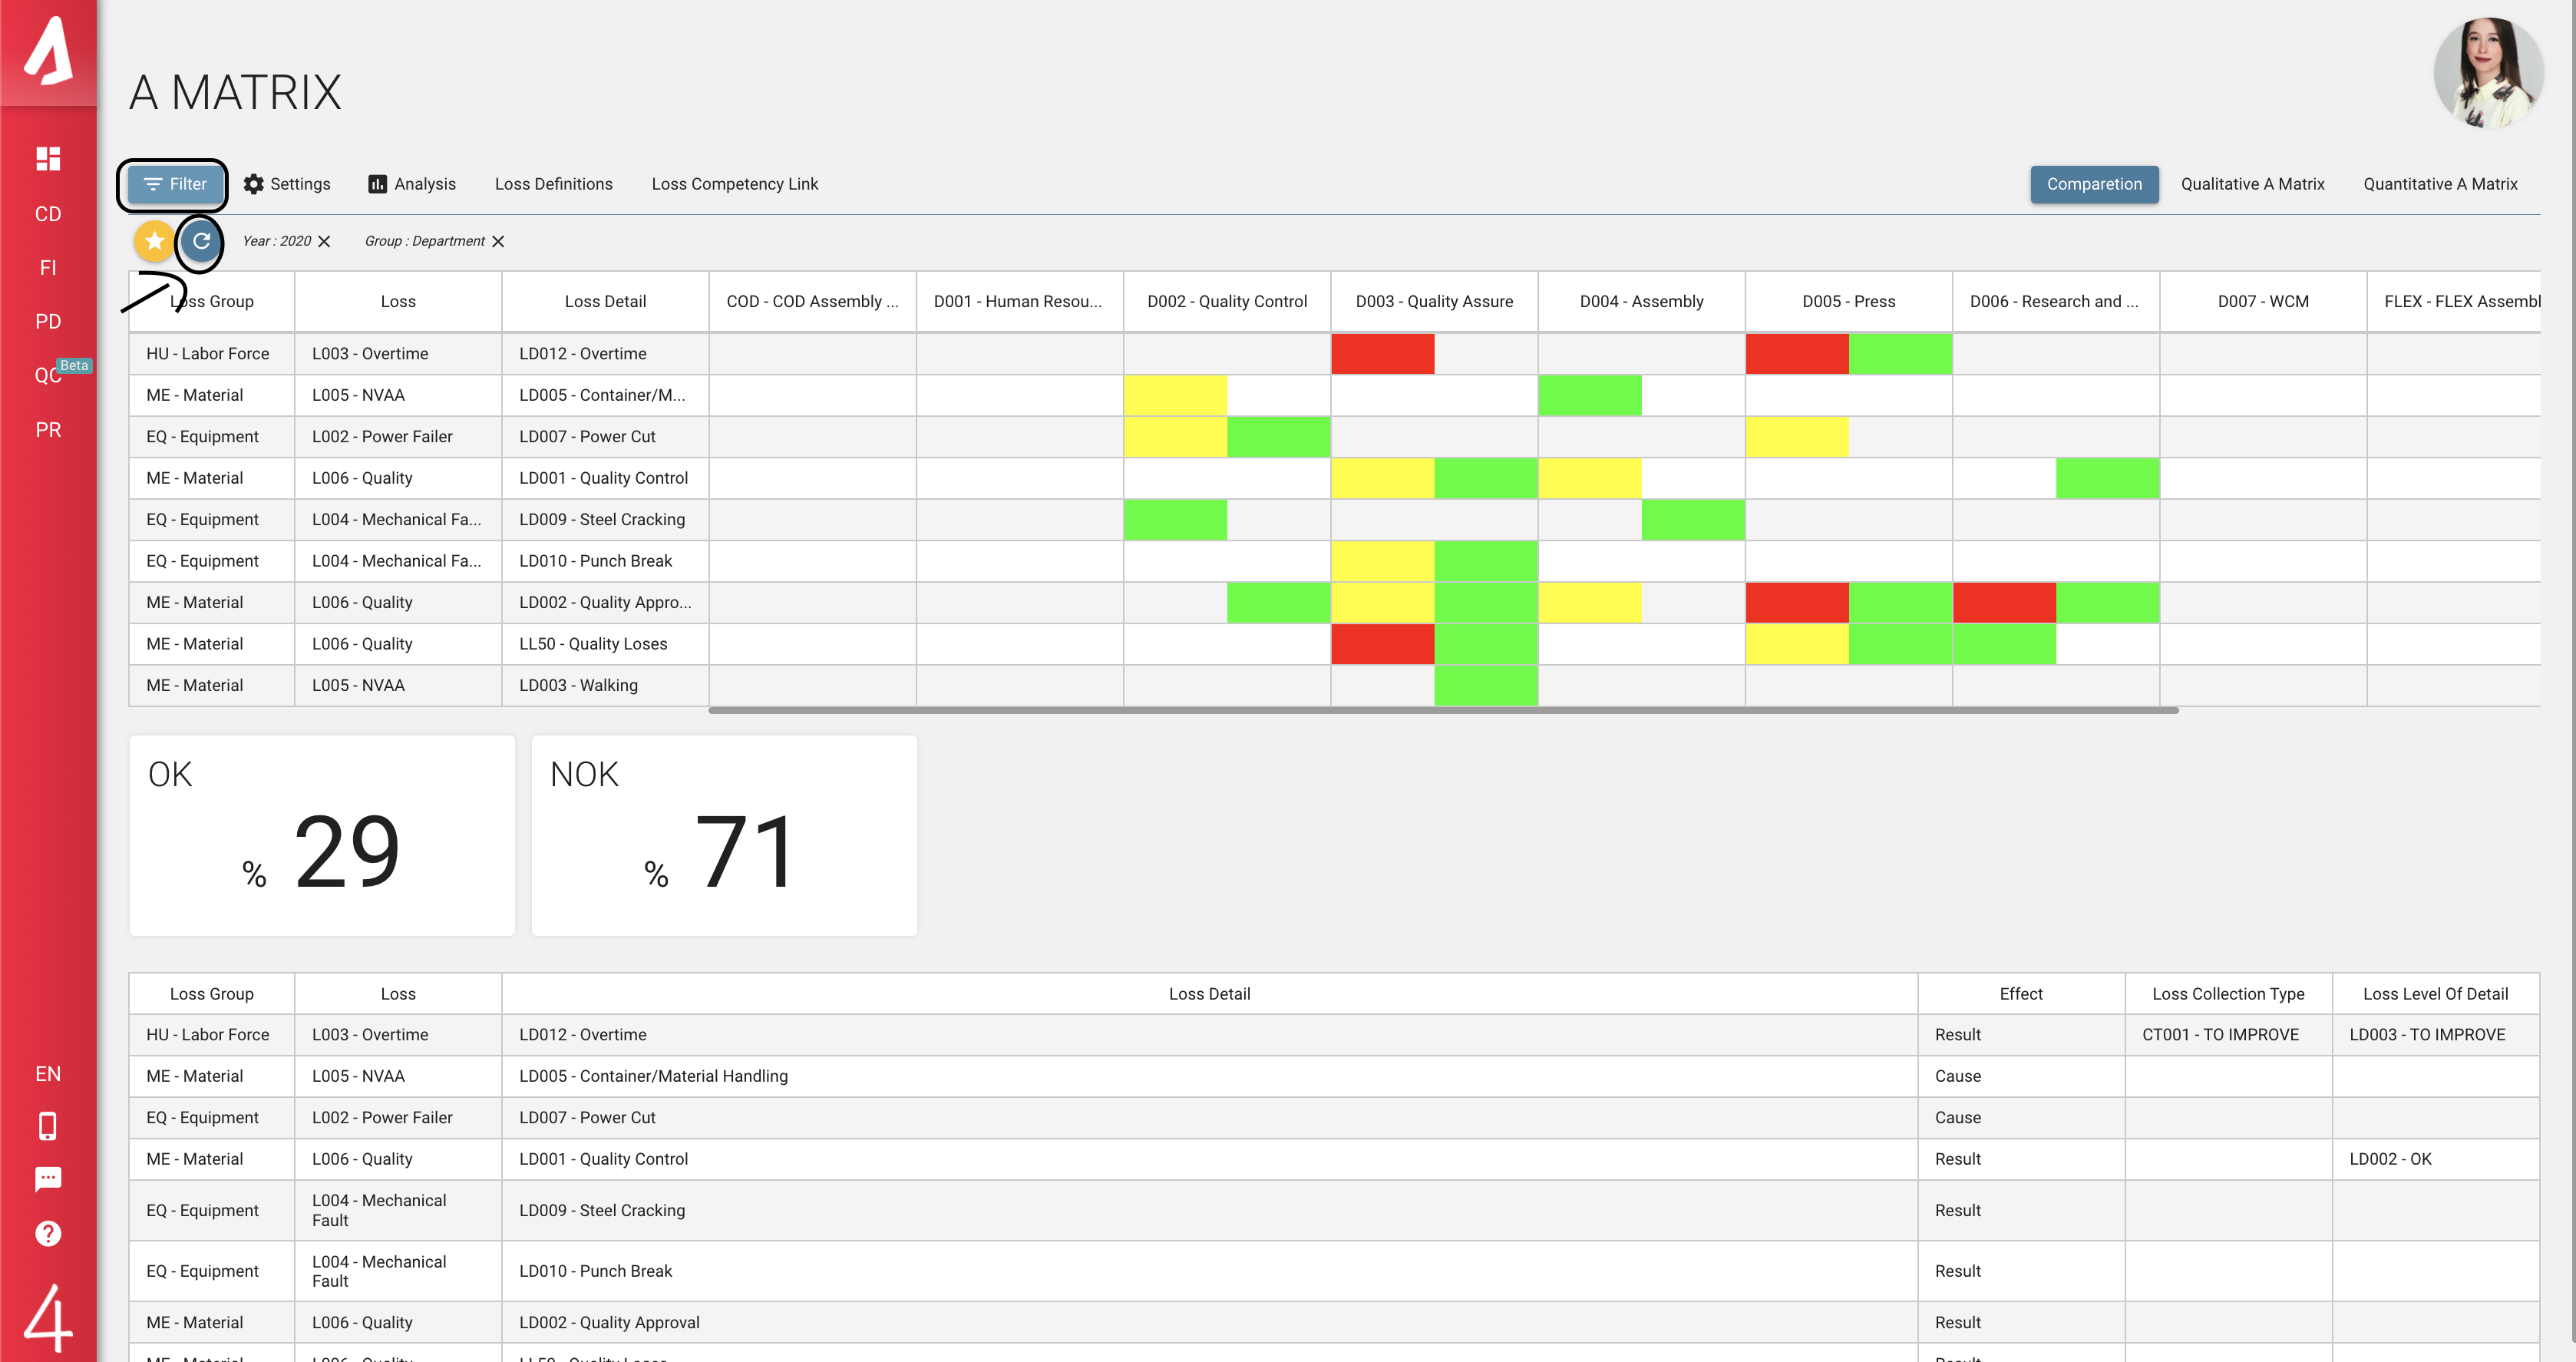
By clicking the Refresh button, you can access the entire list of the A Matrix. By clicking the Filter button, you can see the desired years list of losses.
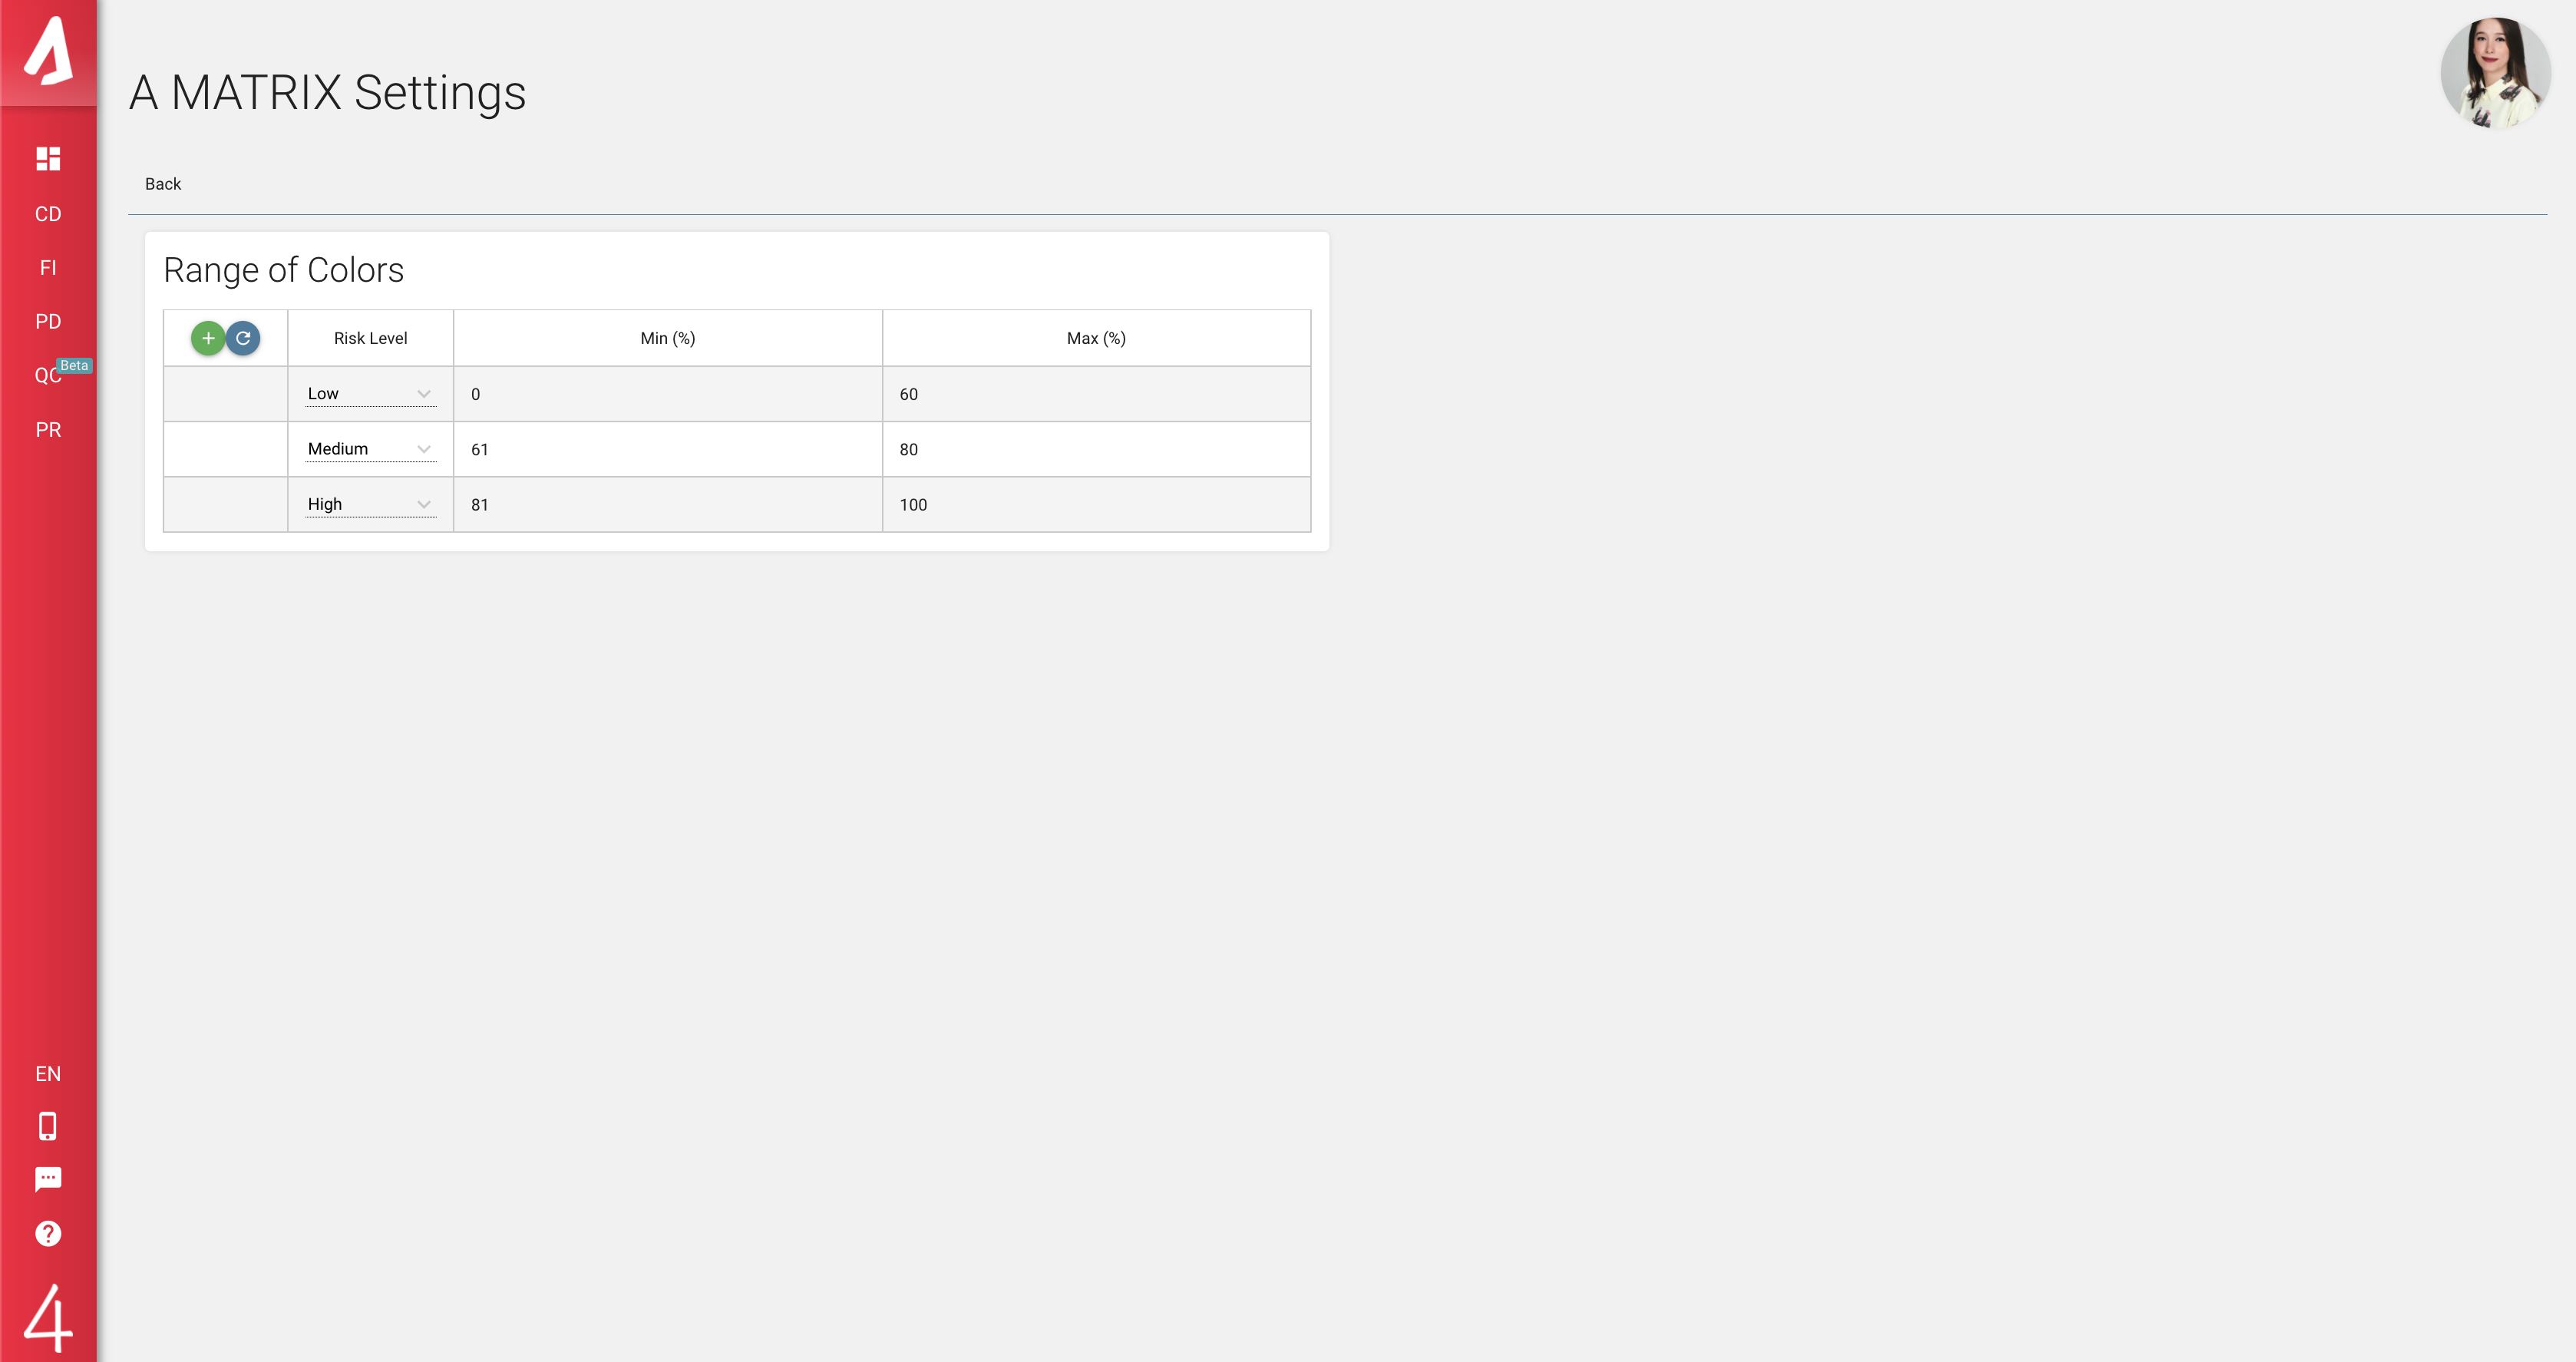
By clicking the **Settings** button on the upper-left corner, you can go to the A Matrix Settings page. You may adjust Risk Levels (_Shown by green, yellow, and red colors_) and define Min (%) and Max (%) values for each risk level. Click to the tick icon to save the adjustments that you have made. To return to the main A Matrix page, click to Back.
There are three buttons on the upper-right corner that allow you to switch between Comperation and Qualitative , Quantitative matrices. Qualitative A Matrix is the section that displays the losses that are based on the personnel's previous experiences. Losses are displayed with colors and do not contain any numeric values.
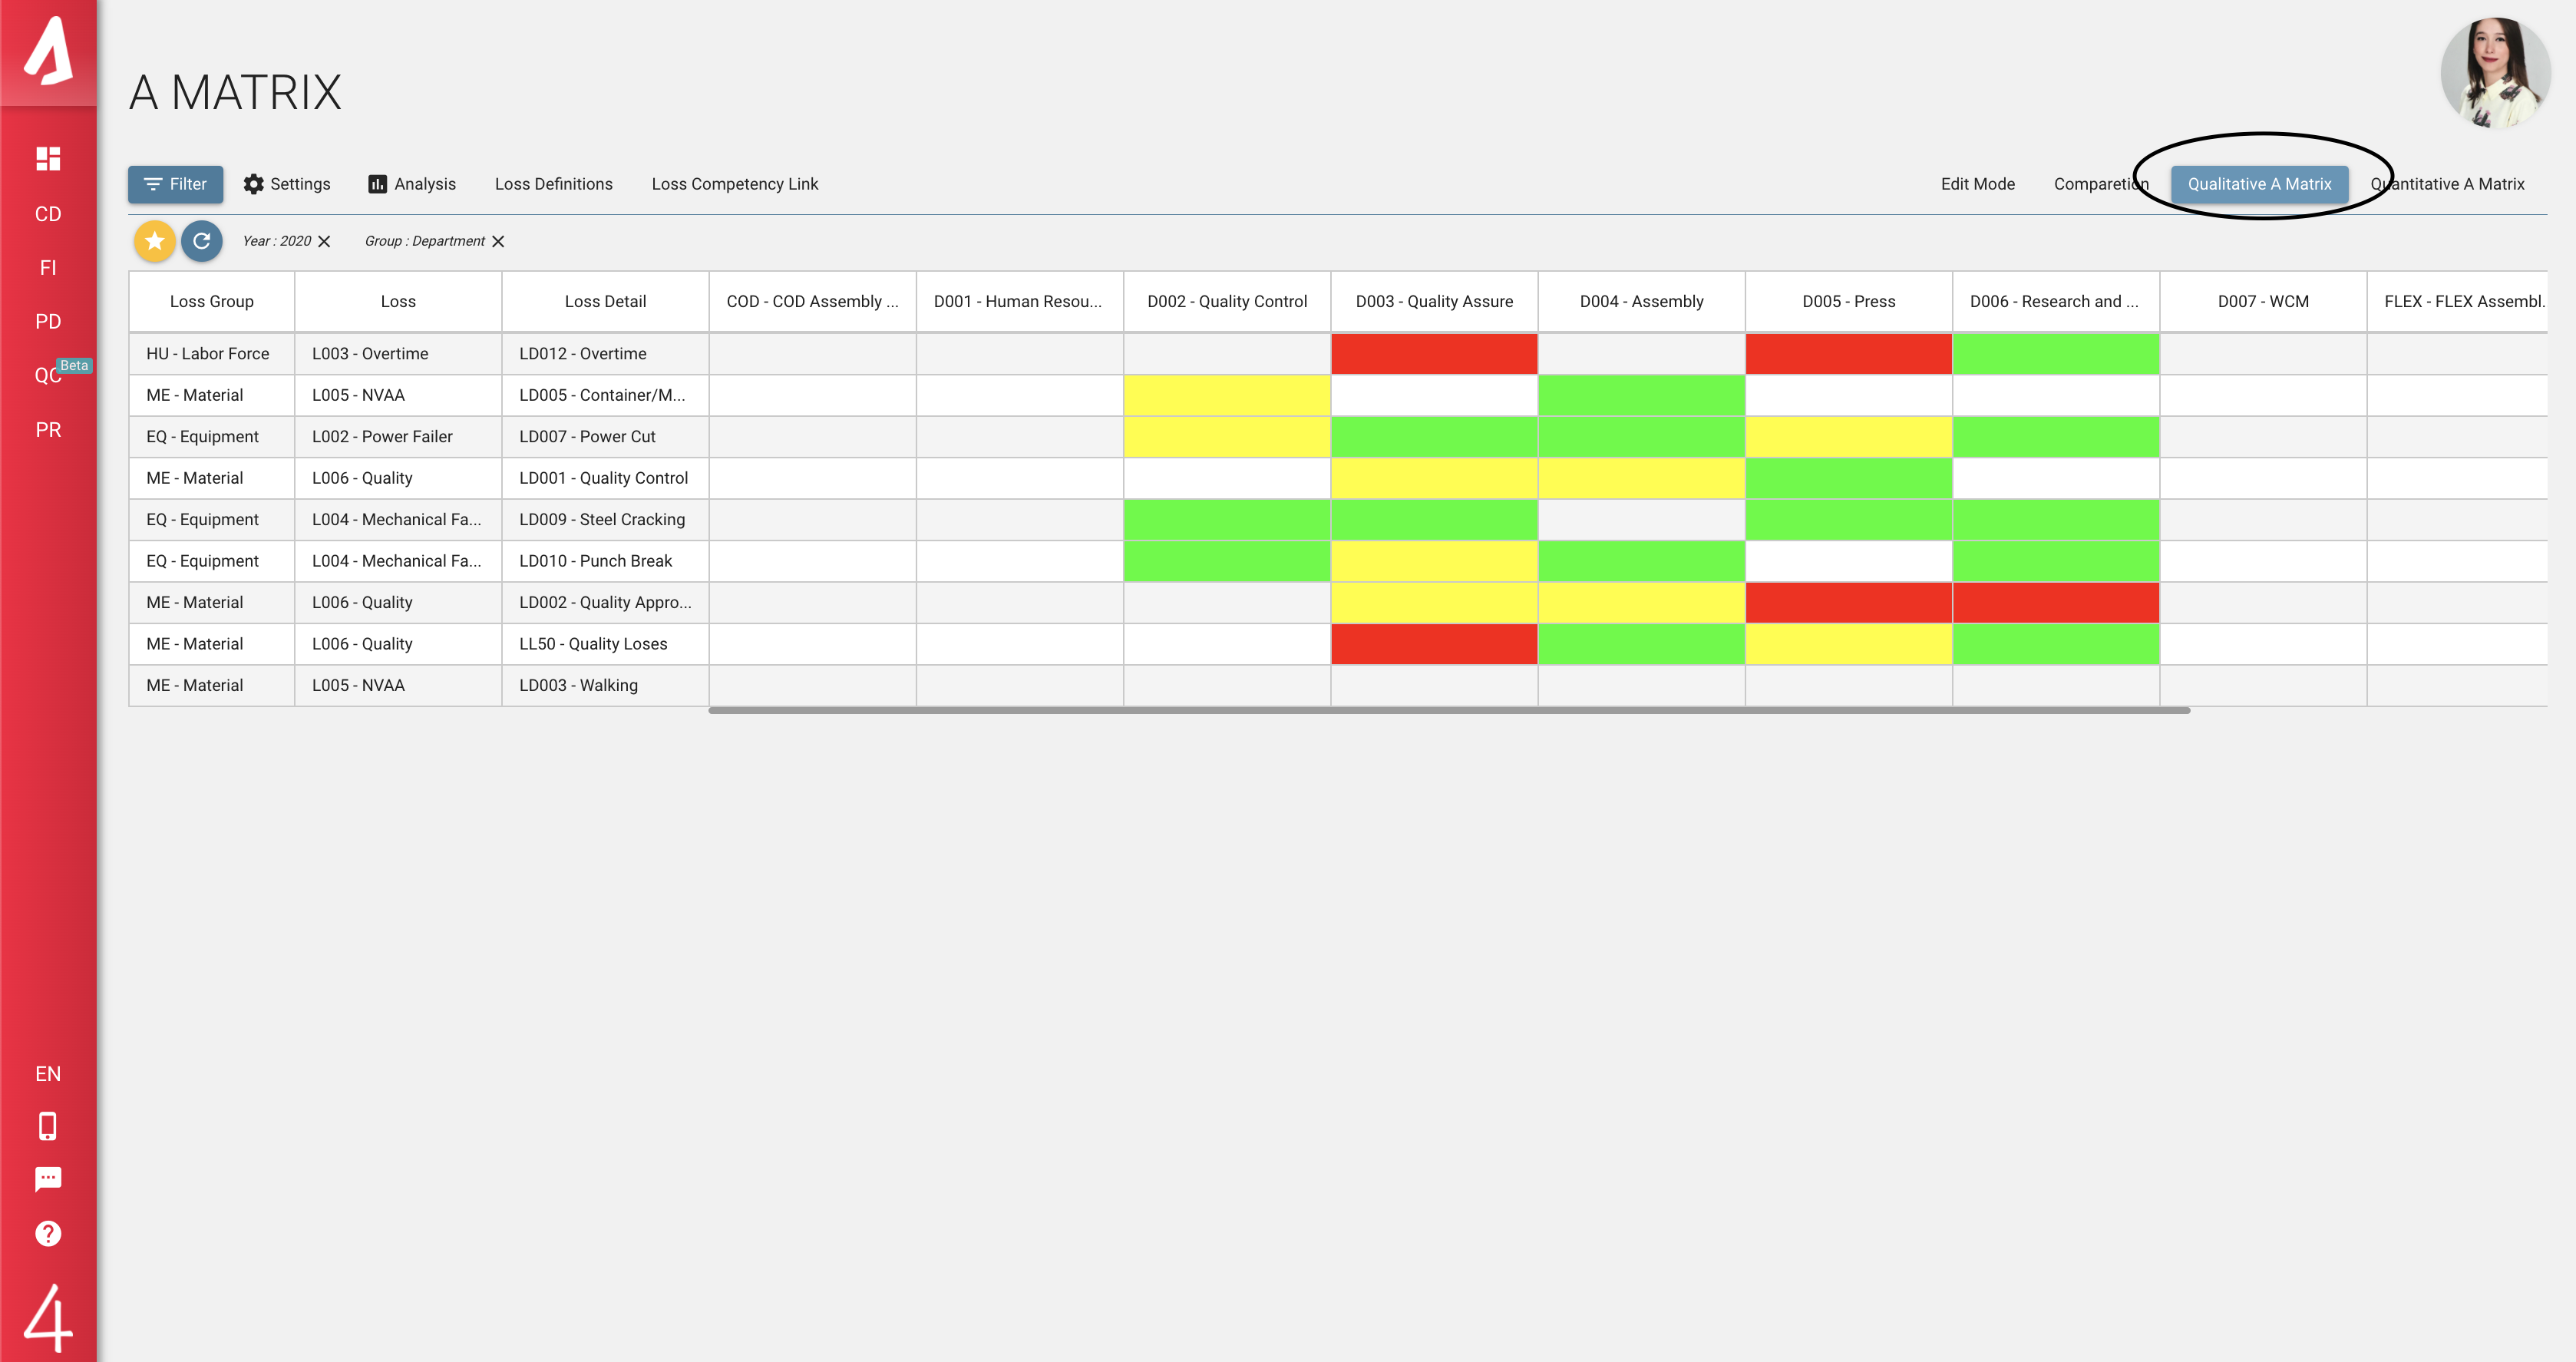
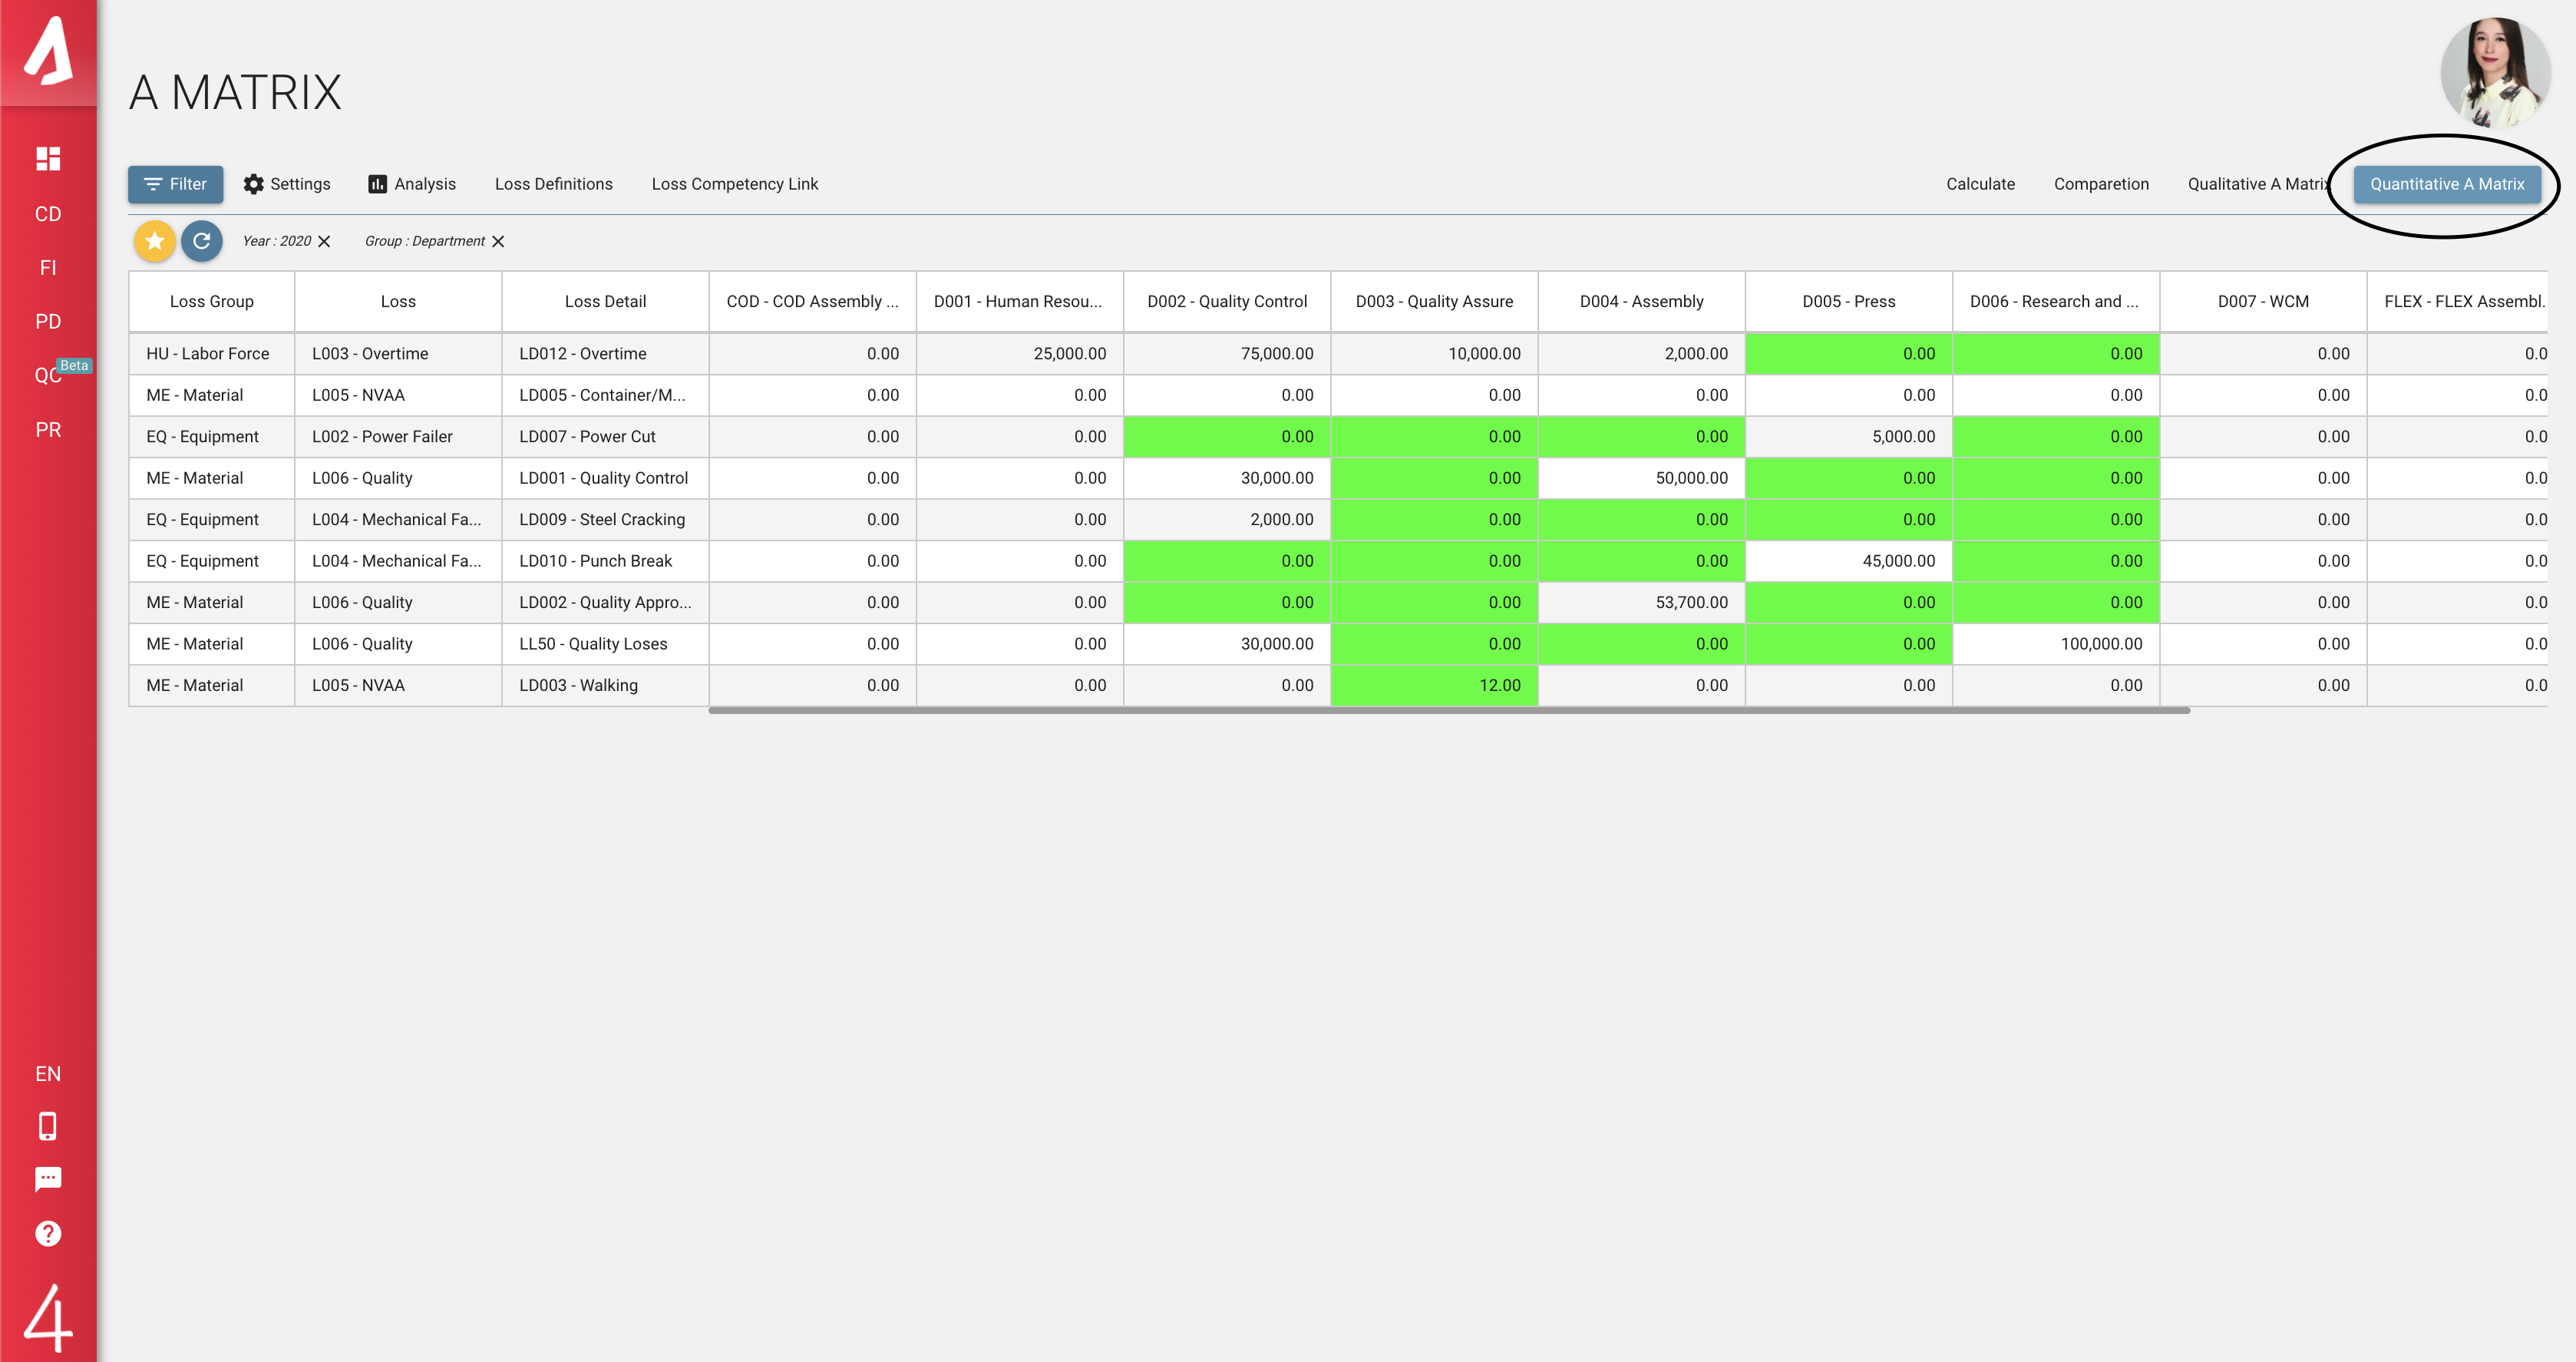
Quantitative A Matrix is the primary matrix, and it has been generated by the data obtained from the yearly C Matrix. In addition to the colored display, it shows actual numeric values. When you click to the Quantitative A Matrix button, the calculate button will appear. When clicked, it refreshes the Entire Factory section and displays the latest data. You can see each line's total amount at the end of the line in the Entire Factory section.
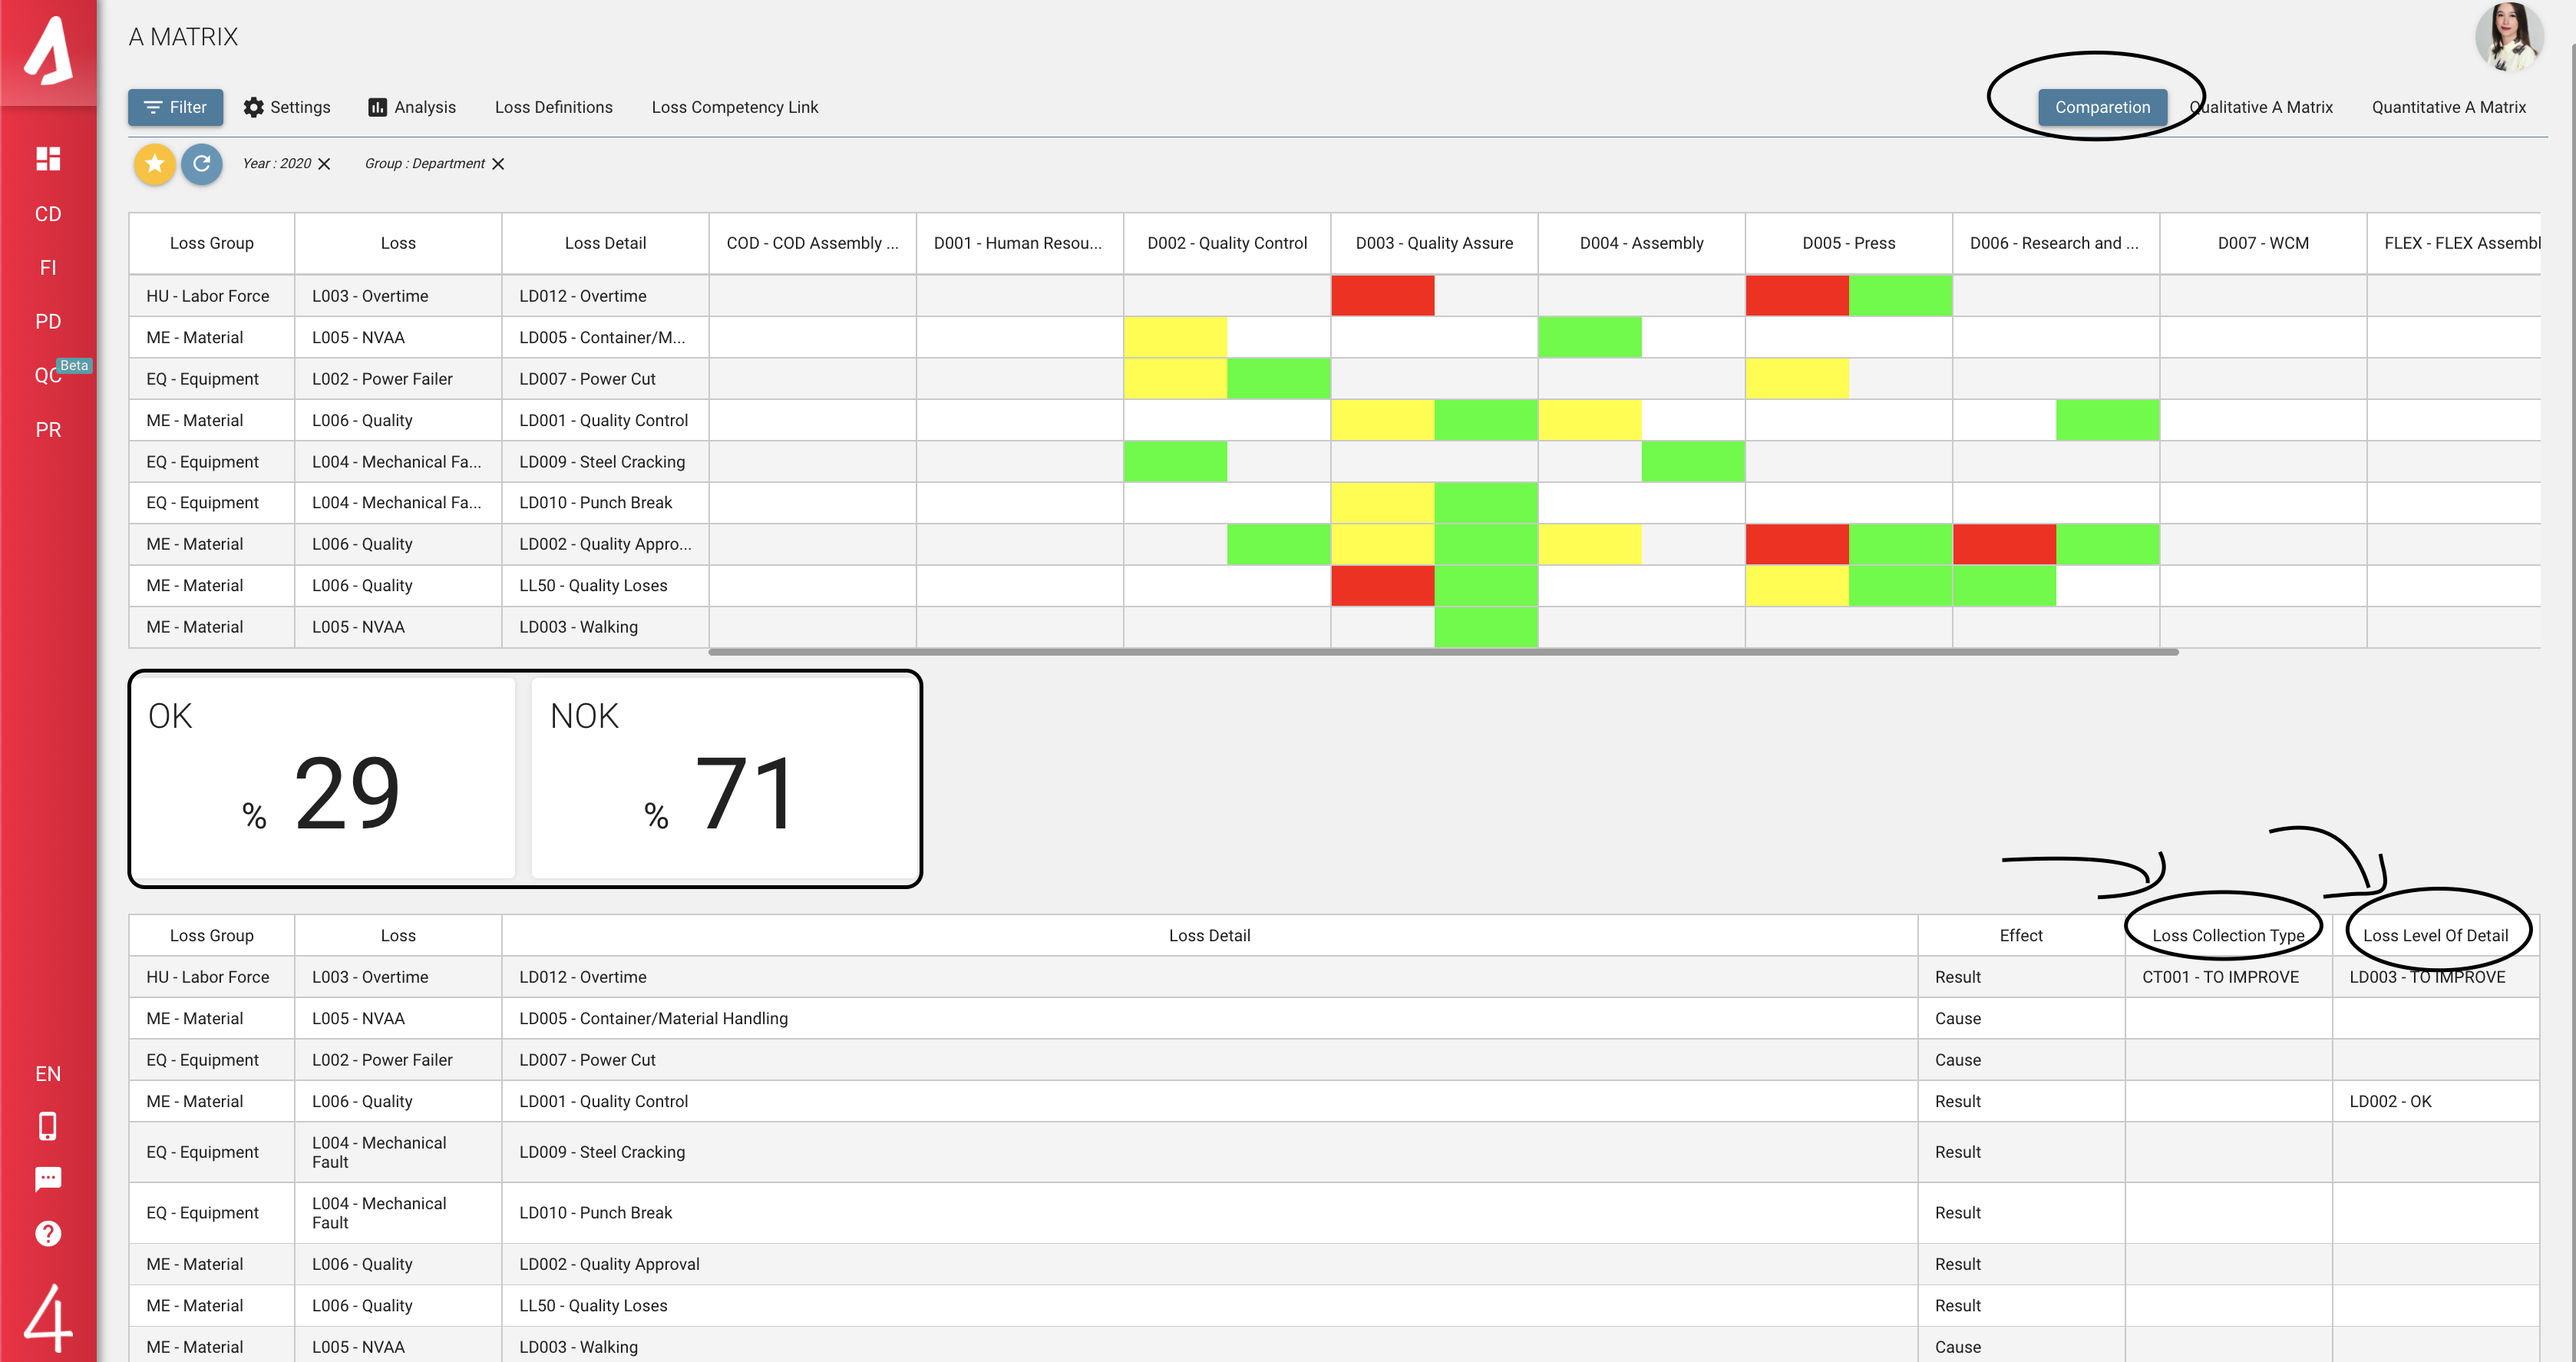
In the Comperation tab, it offers you a comparison matrix where you can compare your Qualitative and Quantitative matrices. Thus, you can compare your experiential information with your actual numerical data. The OK and NOK indicators, which are just below the A Matrix table, show you how much the Qualitative and Quantitive A Matrixes match and do not match. Below these indicators is a table of losses. This table has data in the Quantitative A matrix and lists the losses that are not marked by experience in the Quantitative A Matrix. In this list, you can see the Loss Collection Type and Loss Level of Detail information about the loss.
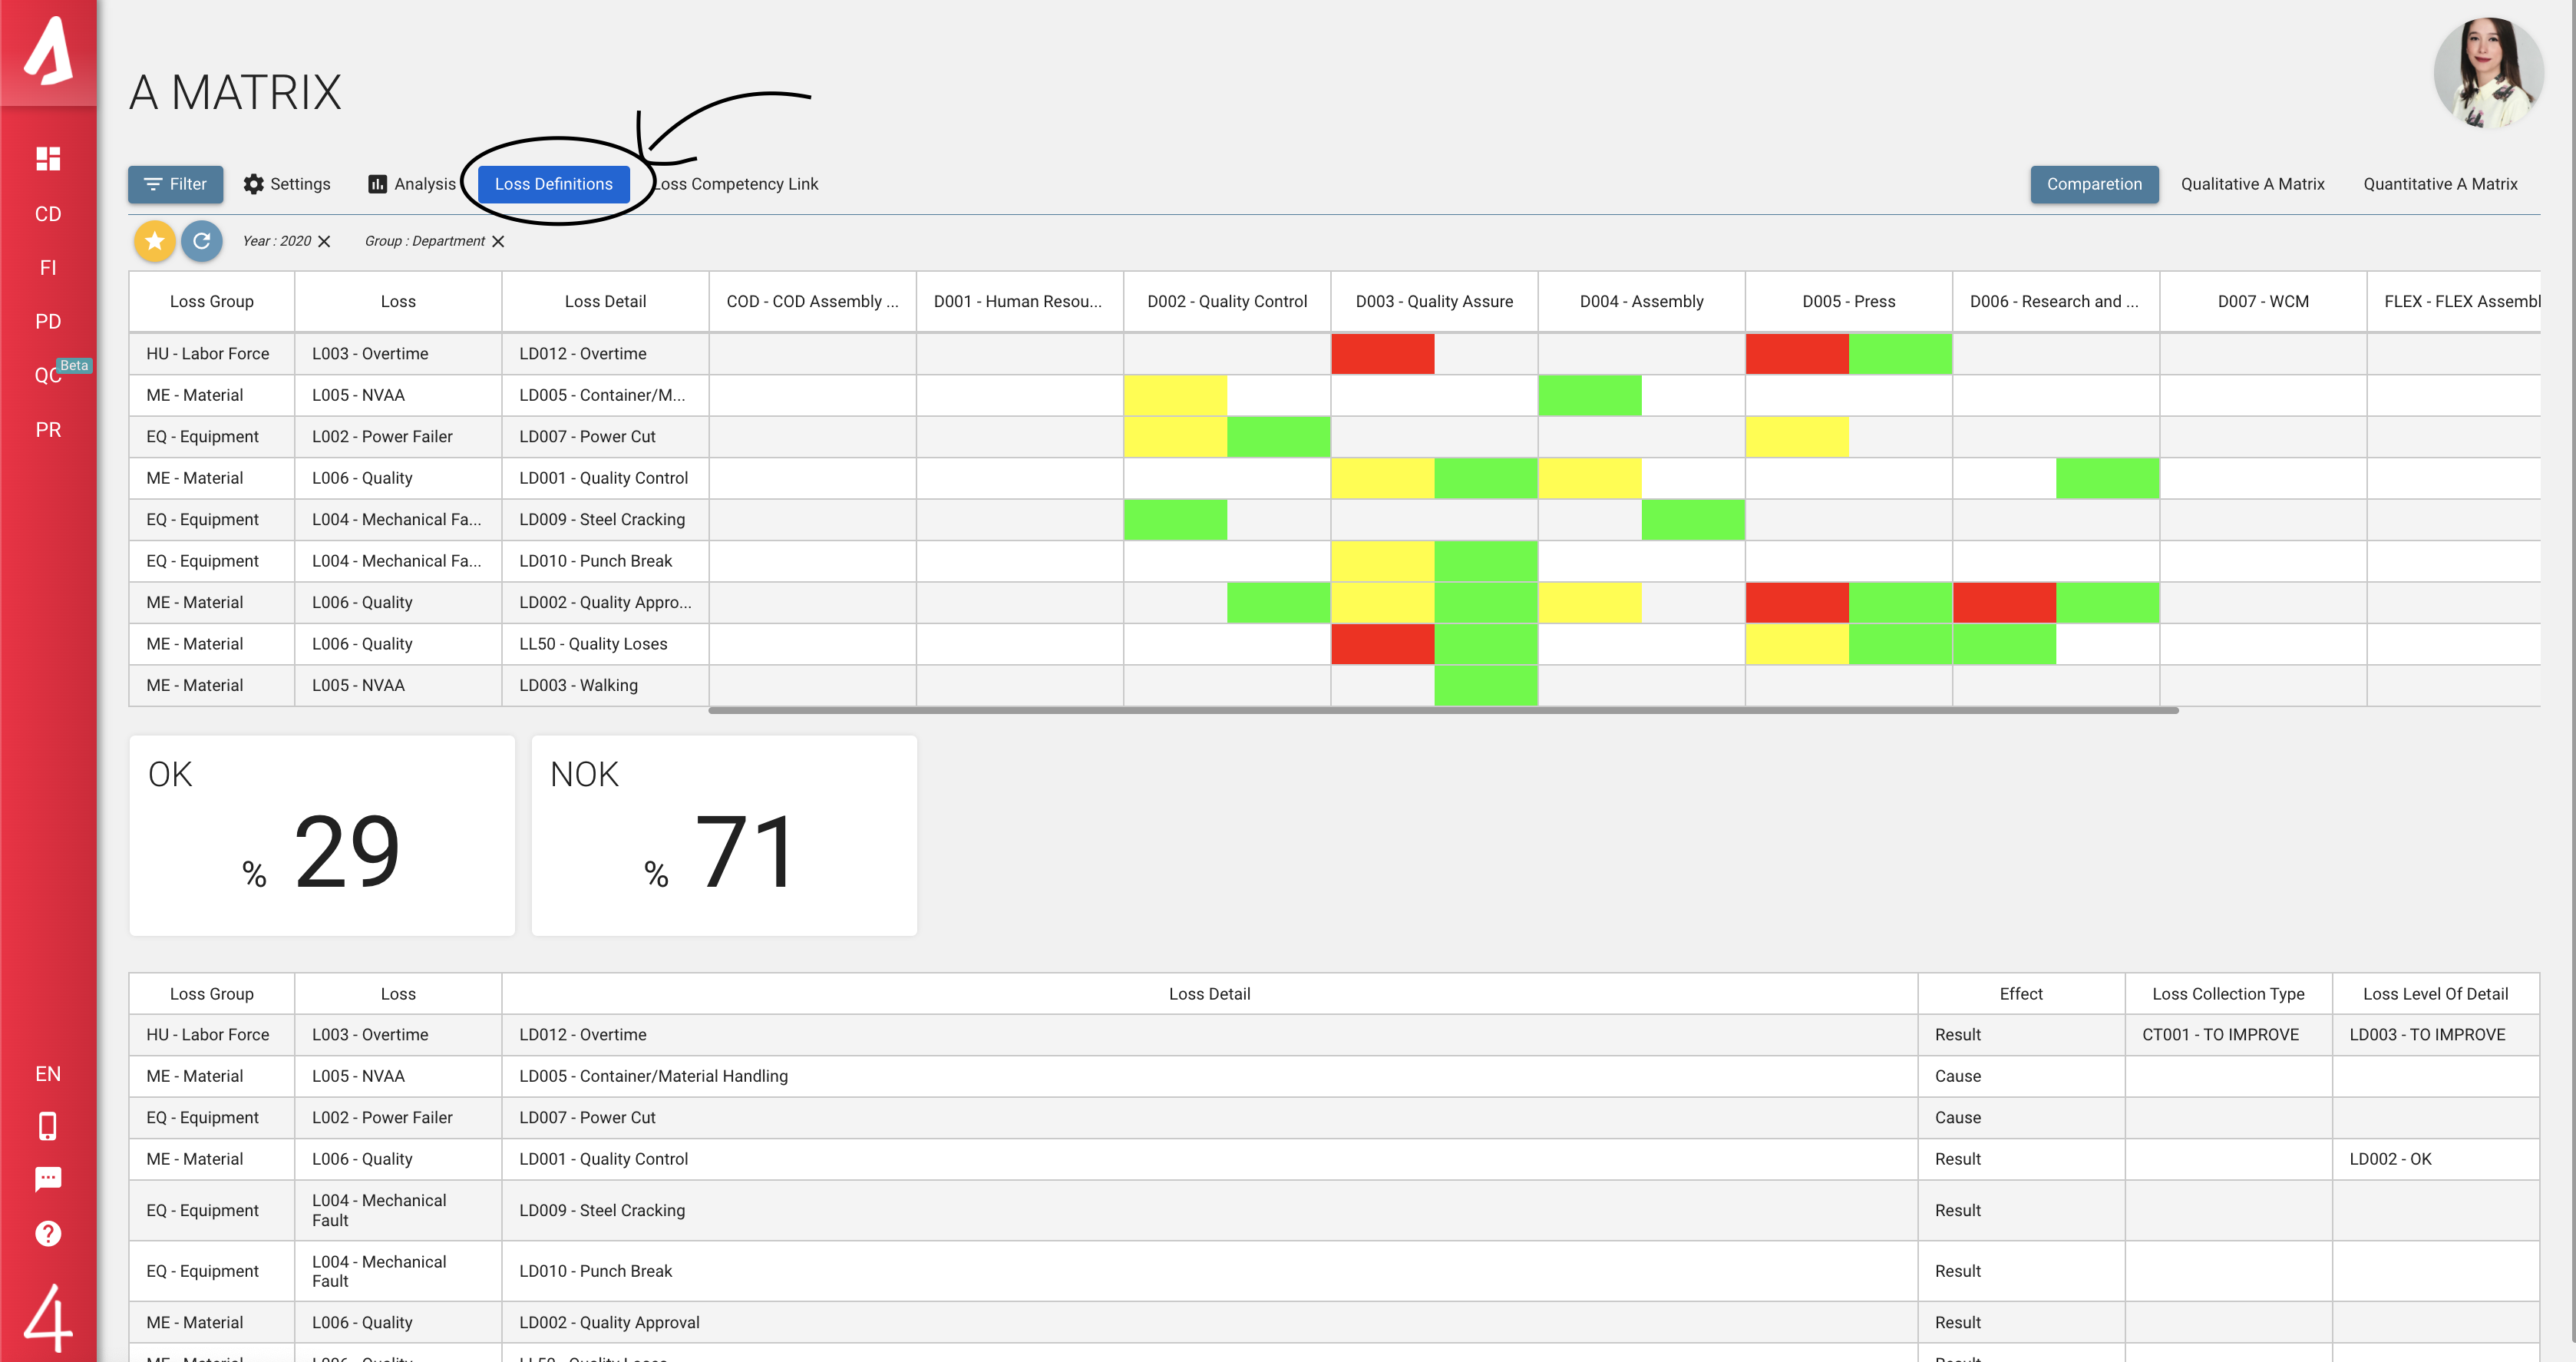
You may access the Loss Definition page by clicking the Loss Definition button on the upper left corner. On that page, you can preview a list of the current loss definitions. You may use the Filter option to preview any desired records.
To add a new Loss Definition, click the Add button, and fill in the required pieces of information. When you have finished, click Save and return to the Loss Definitions page. When you click Refresh, you will see the updated Loss Definitions list.
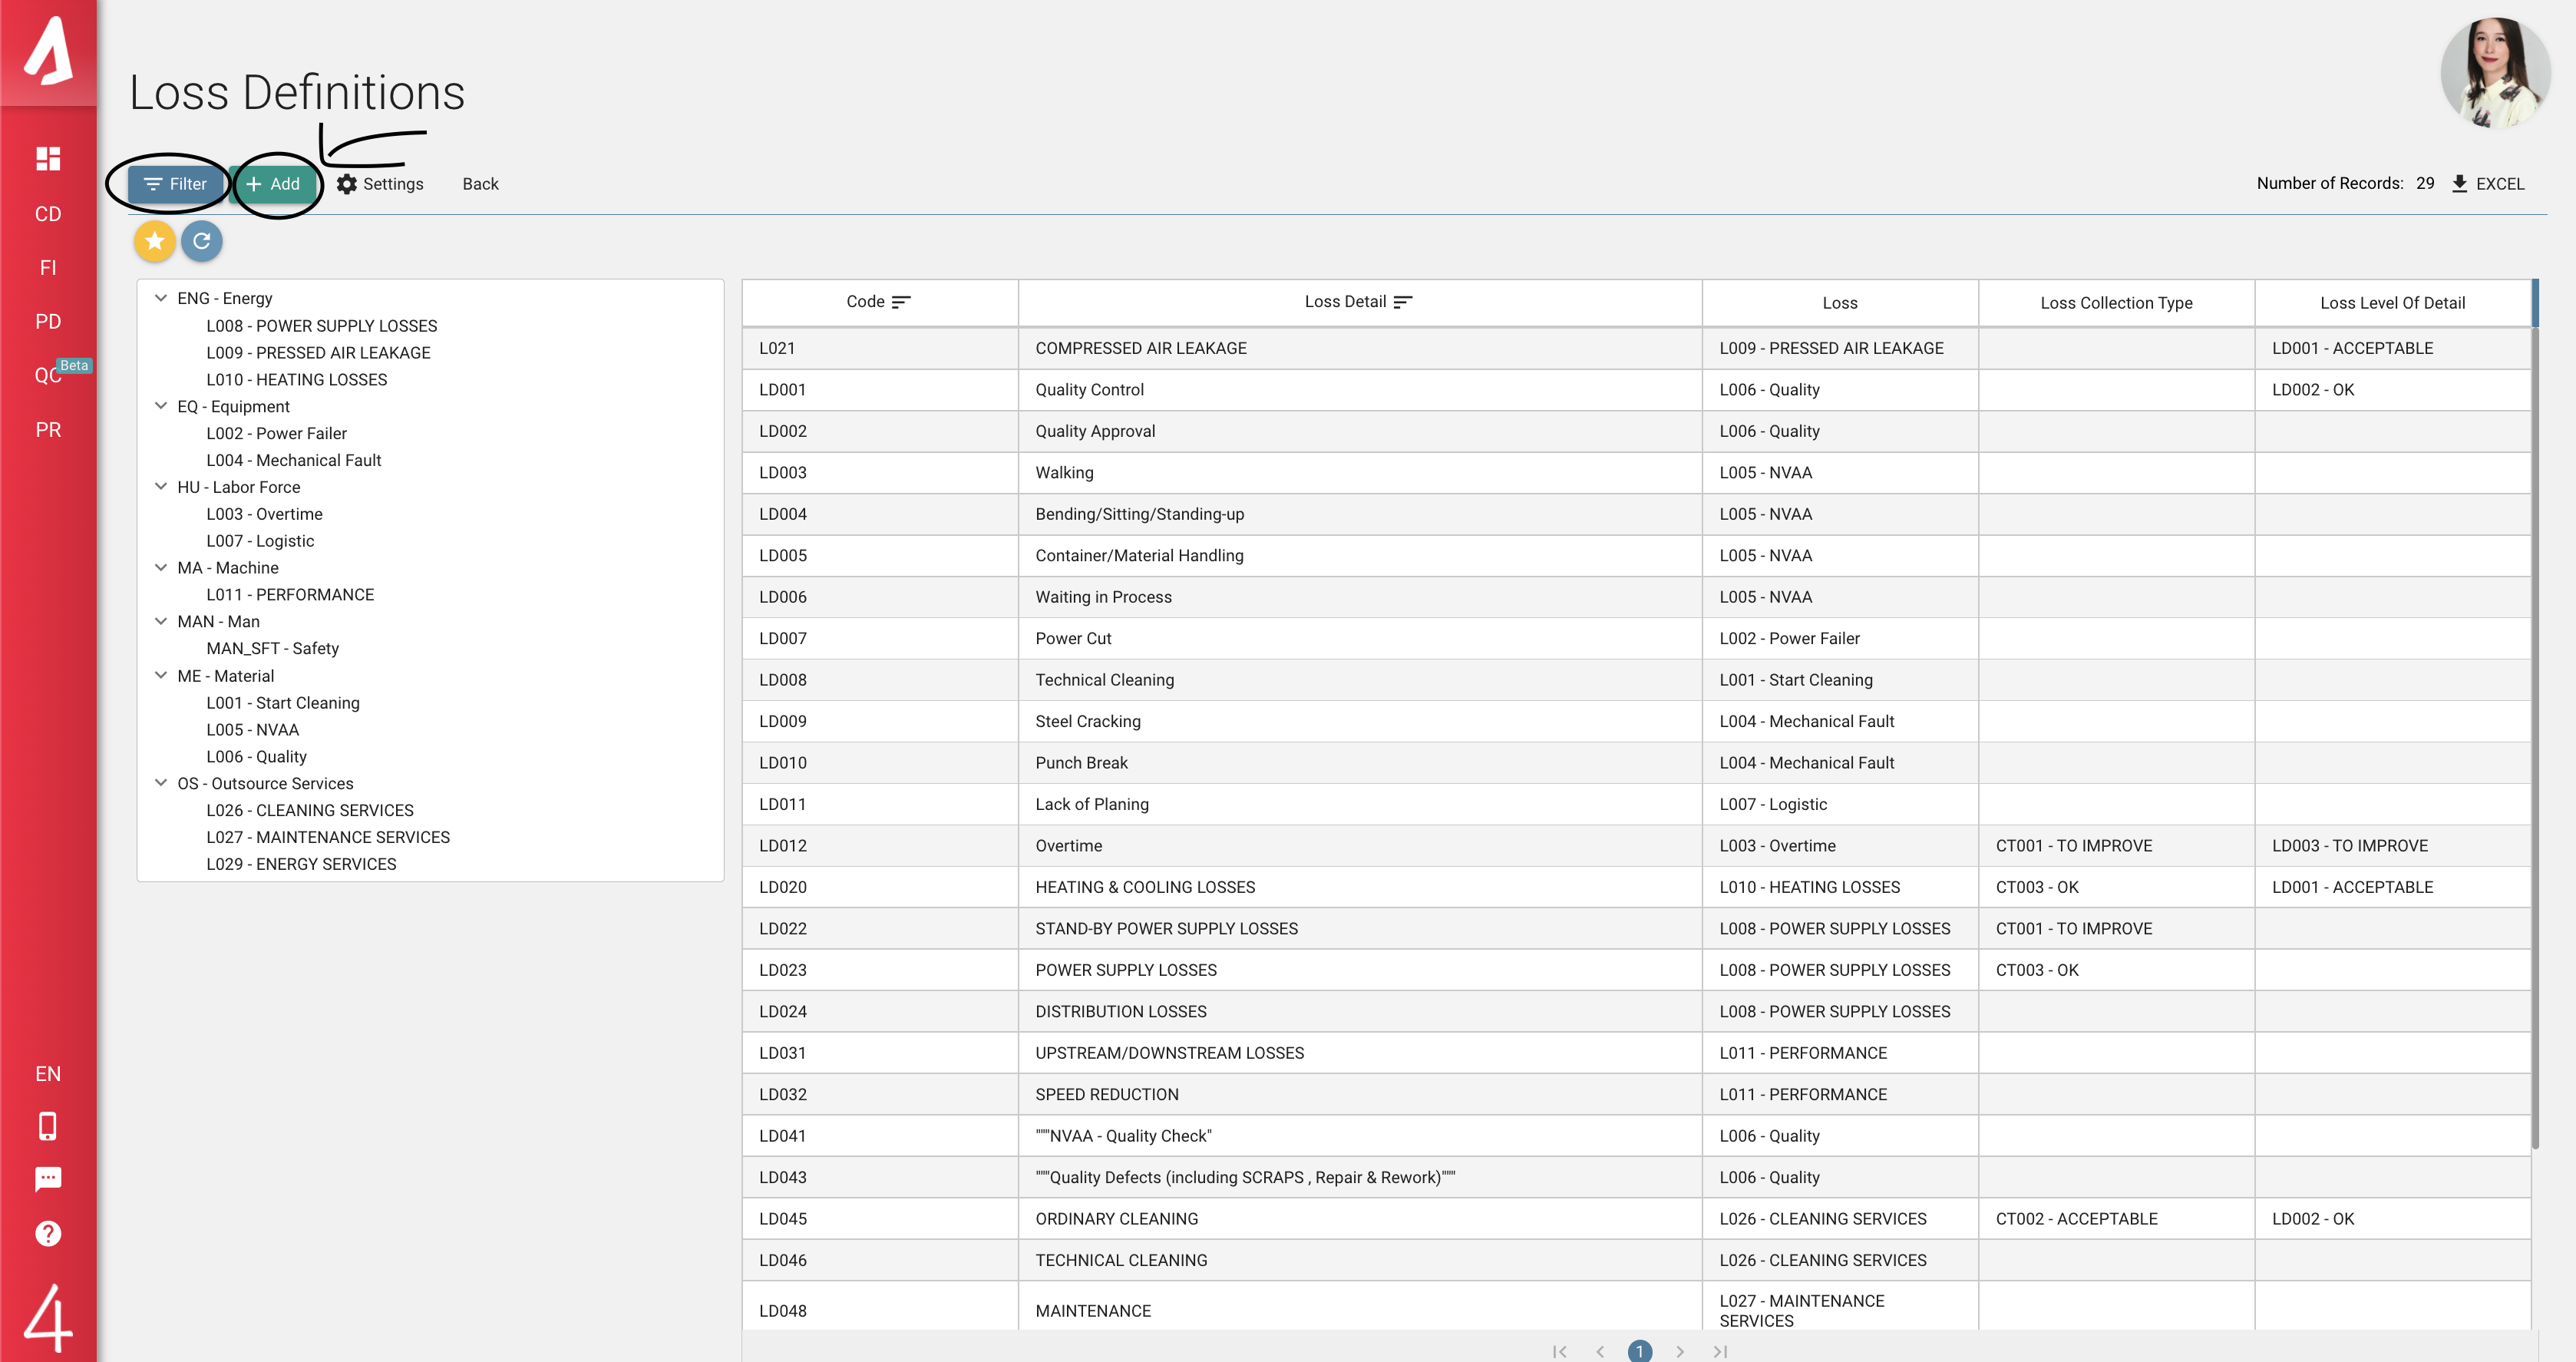
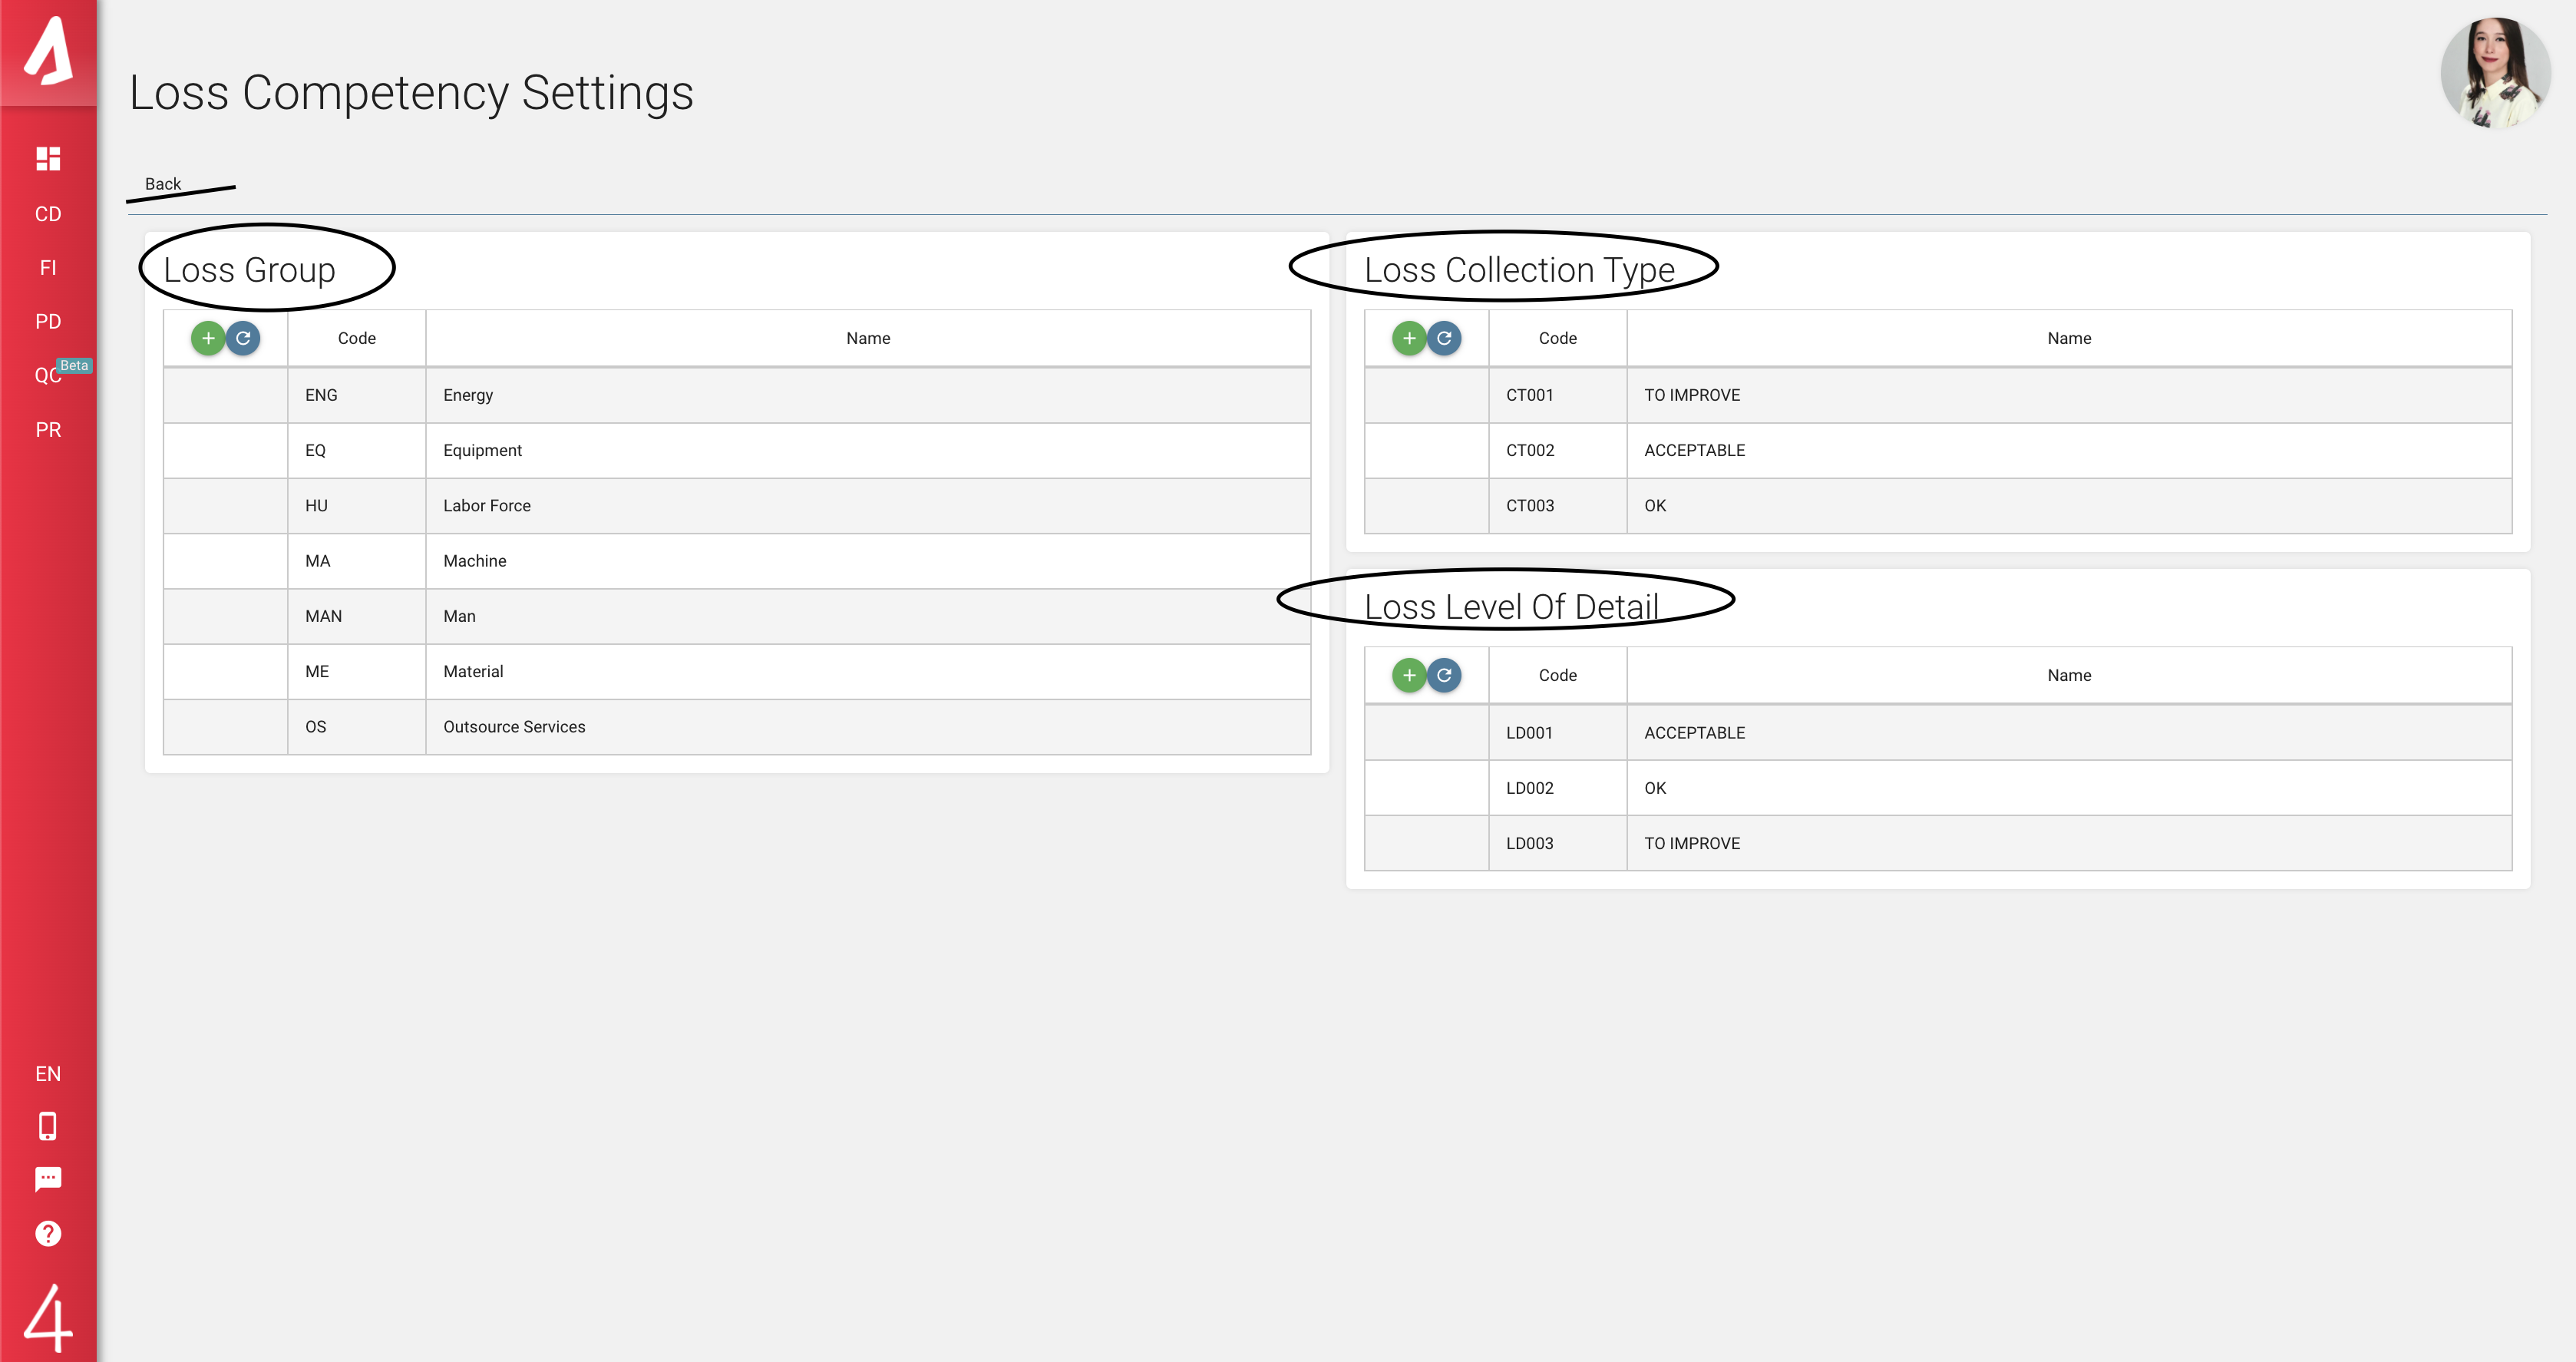
To manage Loss Definition Group , Loss Collection Type and Level of Detail click Settings and go to the Loss Definition Settings page. In here, you may add new records to the Loss Group table or edit the previous records. After you have finished, save your changes and return to the Loss Definitions page.
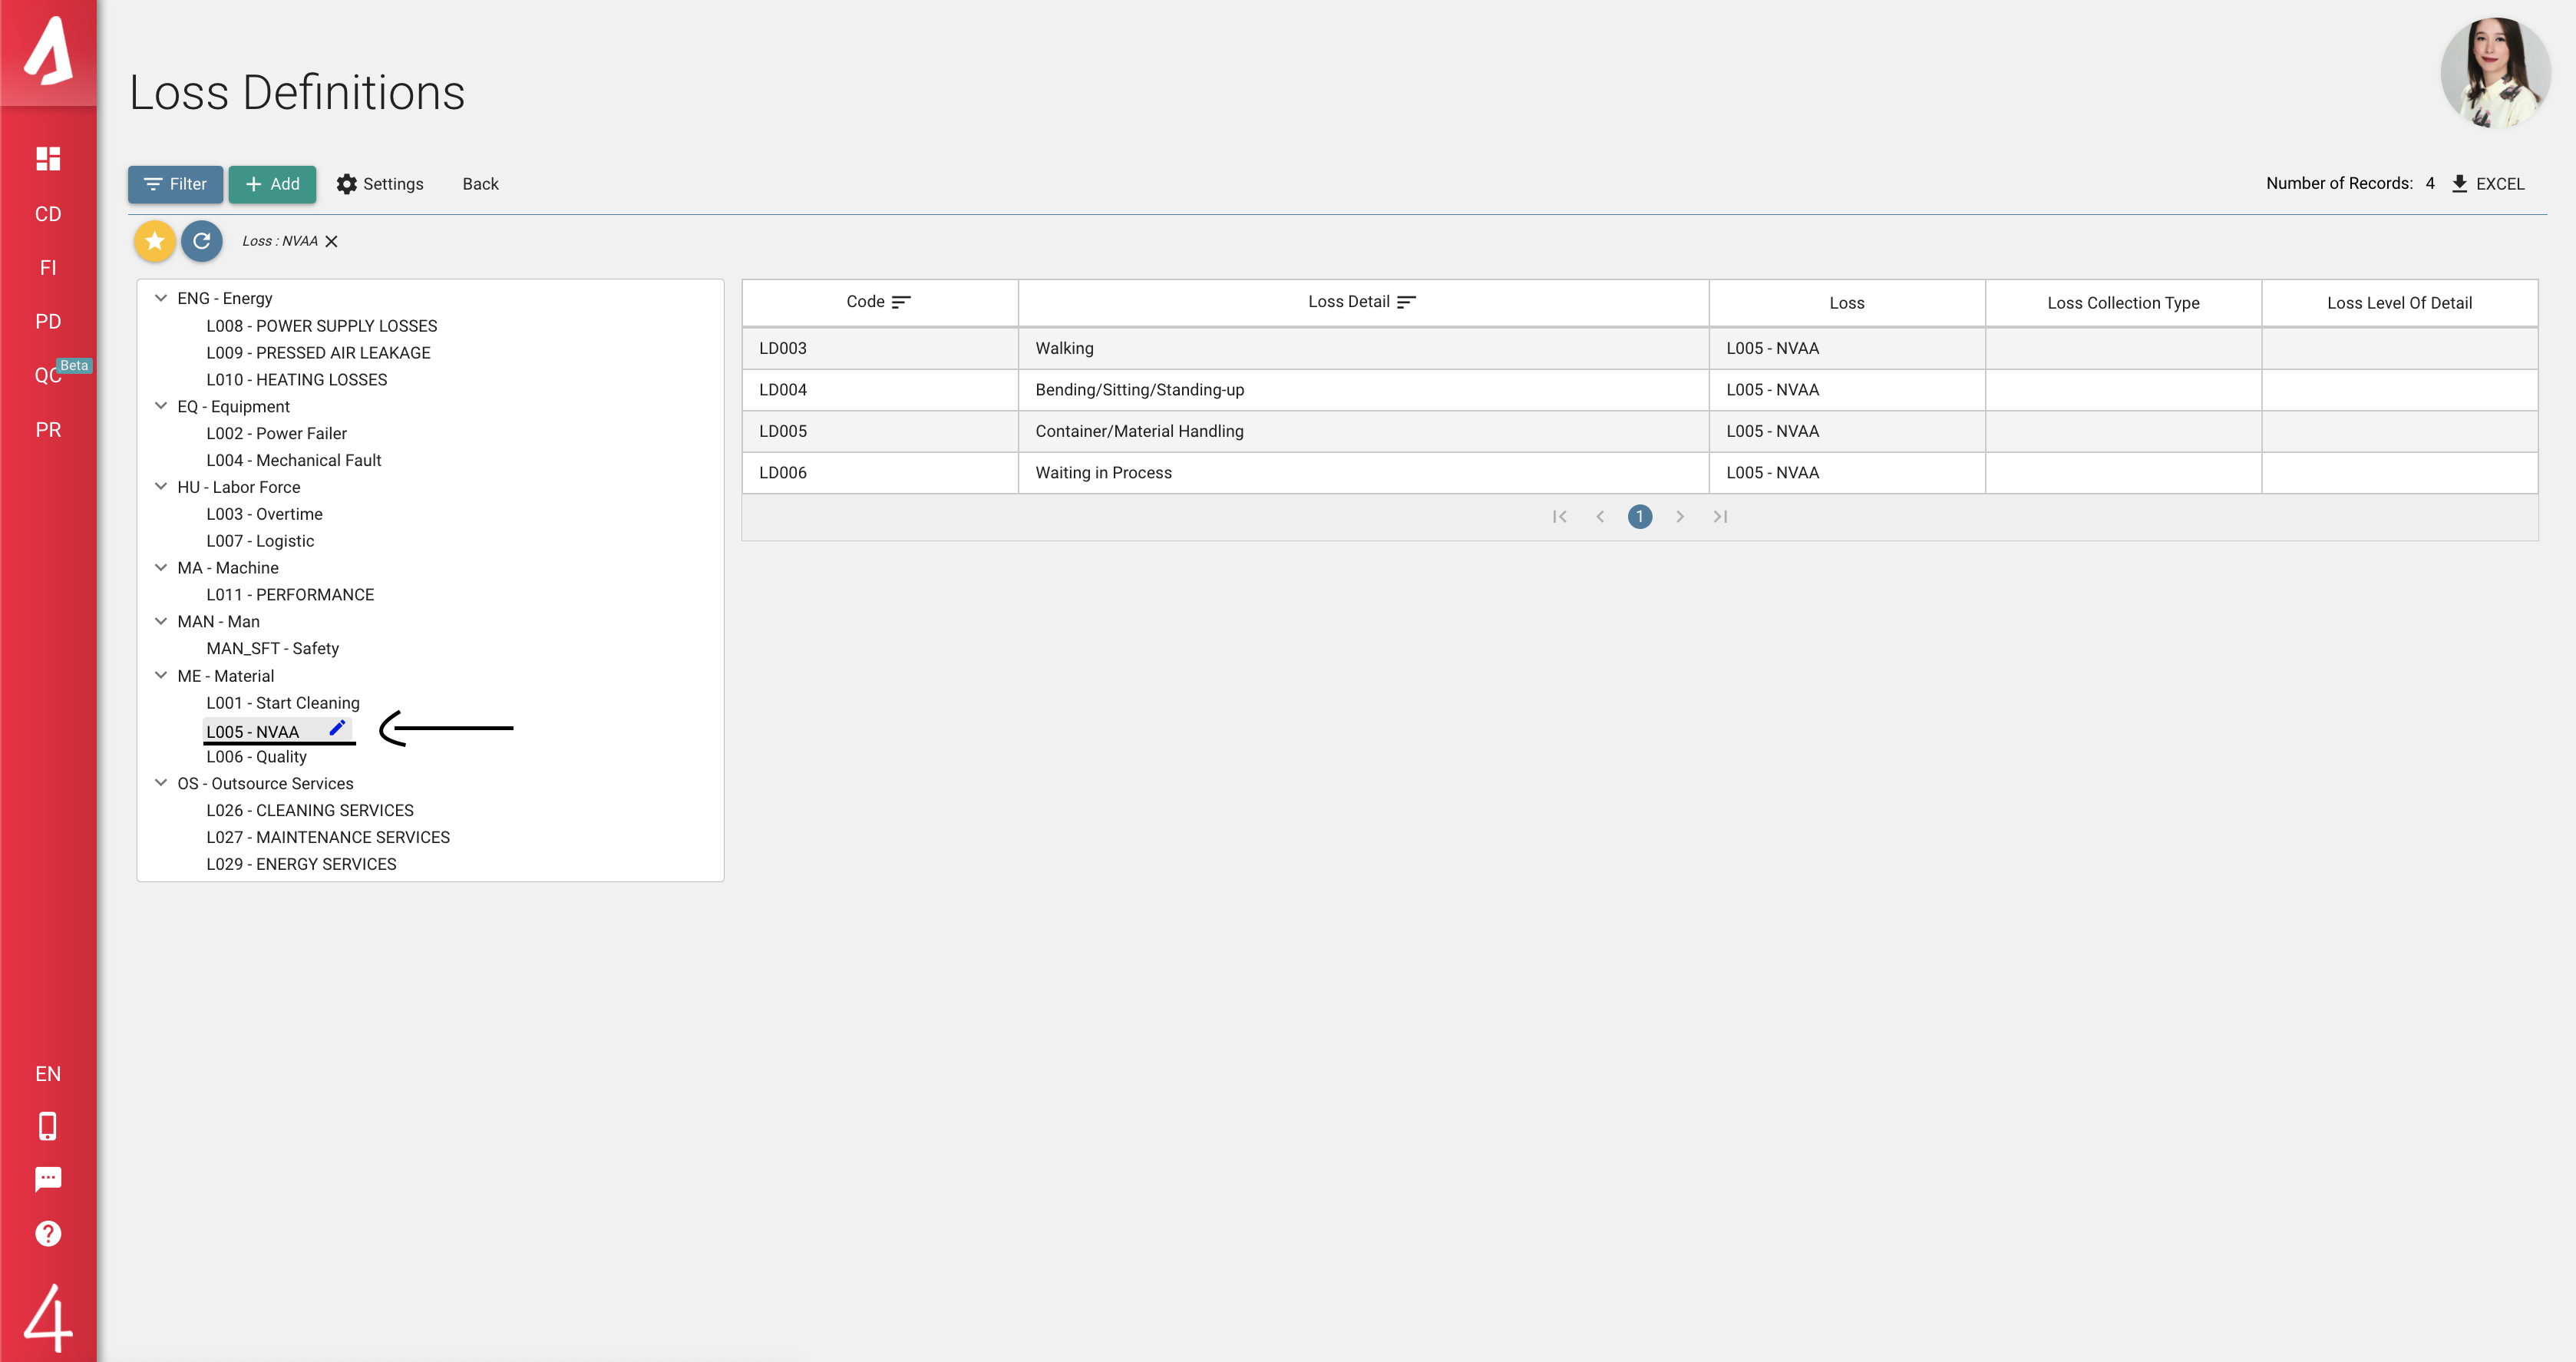
On the Loss Definitions page, you will see a tree list on the left side. That list allows you to preview and categorize losses easily. When you click on a loss in the tree, details and sub-losses of the corresponding loss will be previewed on a list. You may edit sub-losses by double clicking on them. To edit a loss on the tree, click the Pencil icon, and you will be able to change the records on the following tab. Do not forget to save your progress when you are finished.
On the main A Matrix page, you may access the Loss Competency Link by clicking on it.
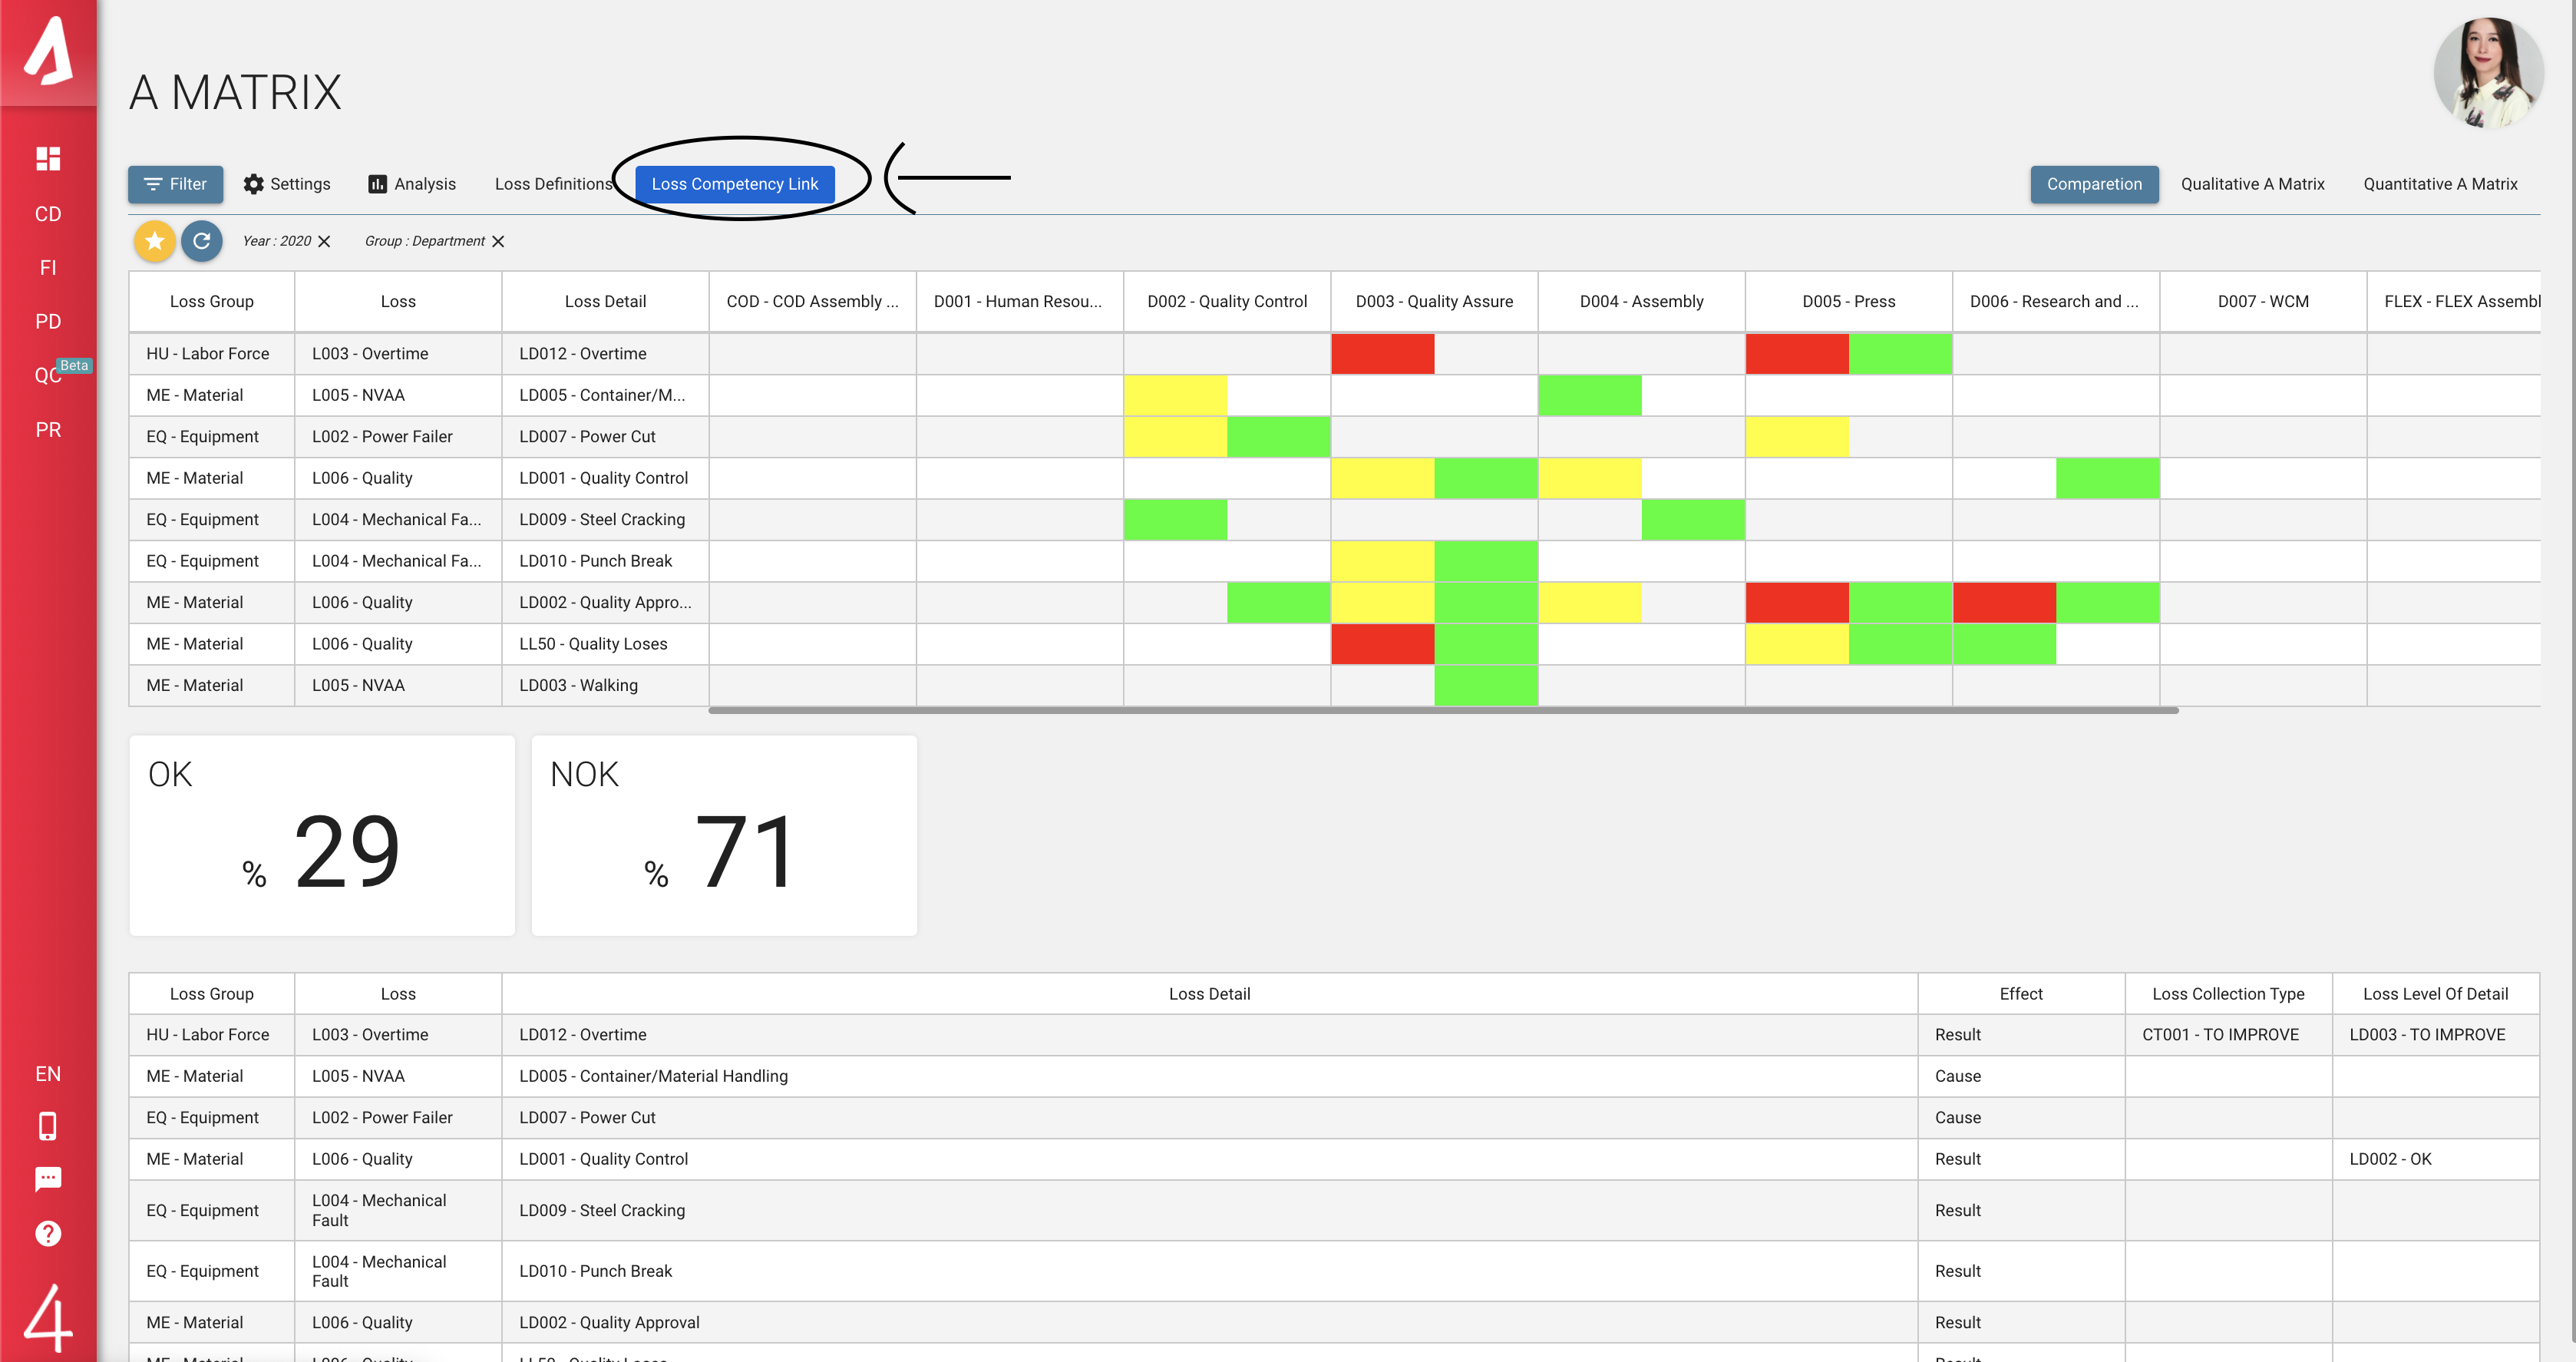
On that page, you will see a list of the current links. You may use the Filter option to preview any desired records.
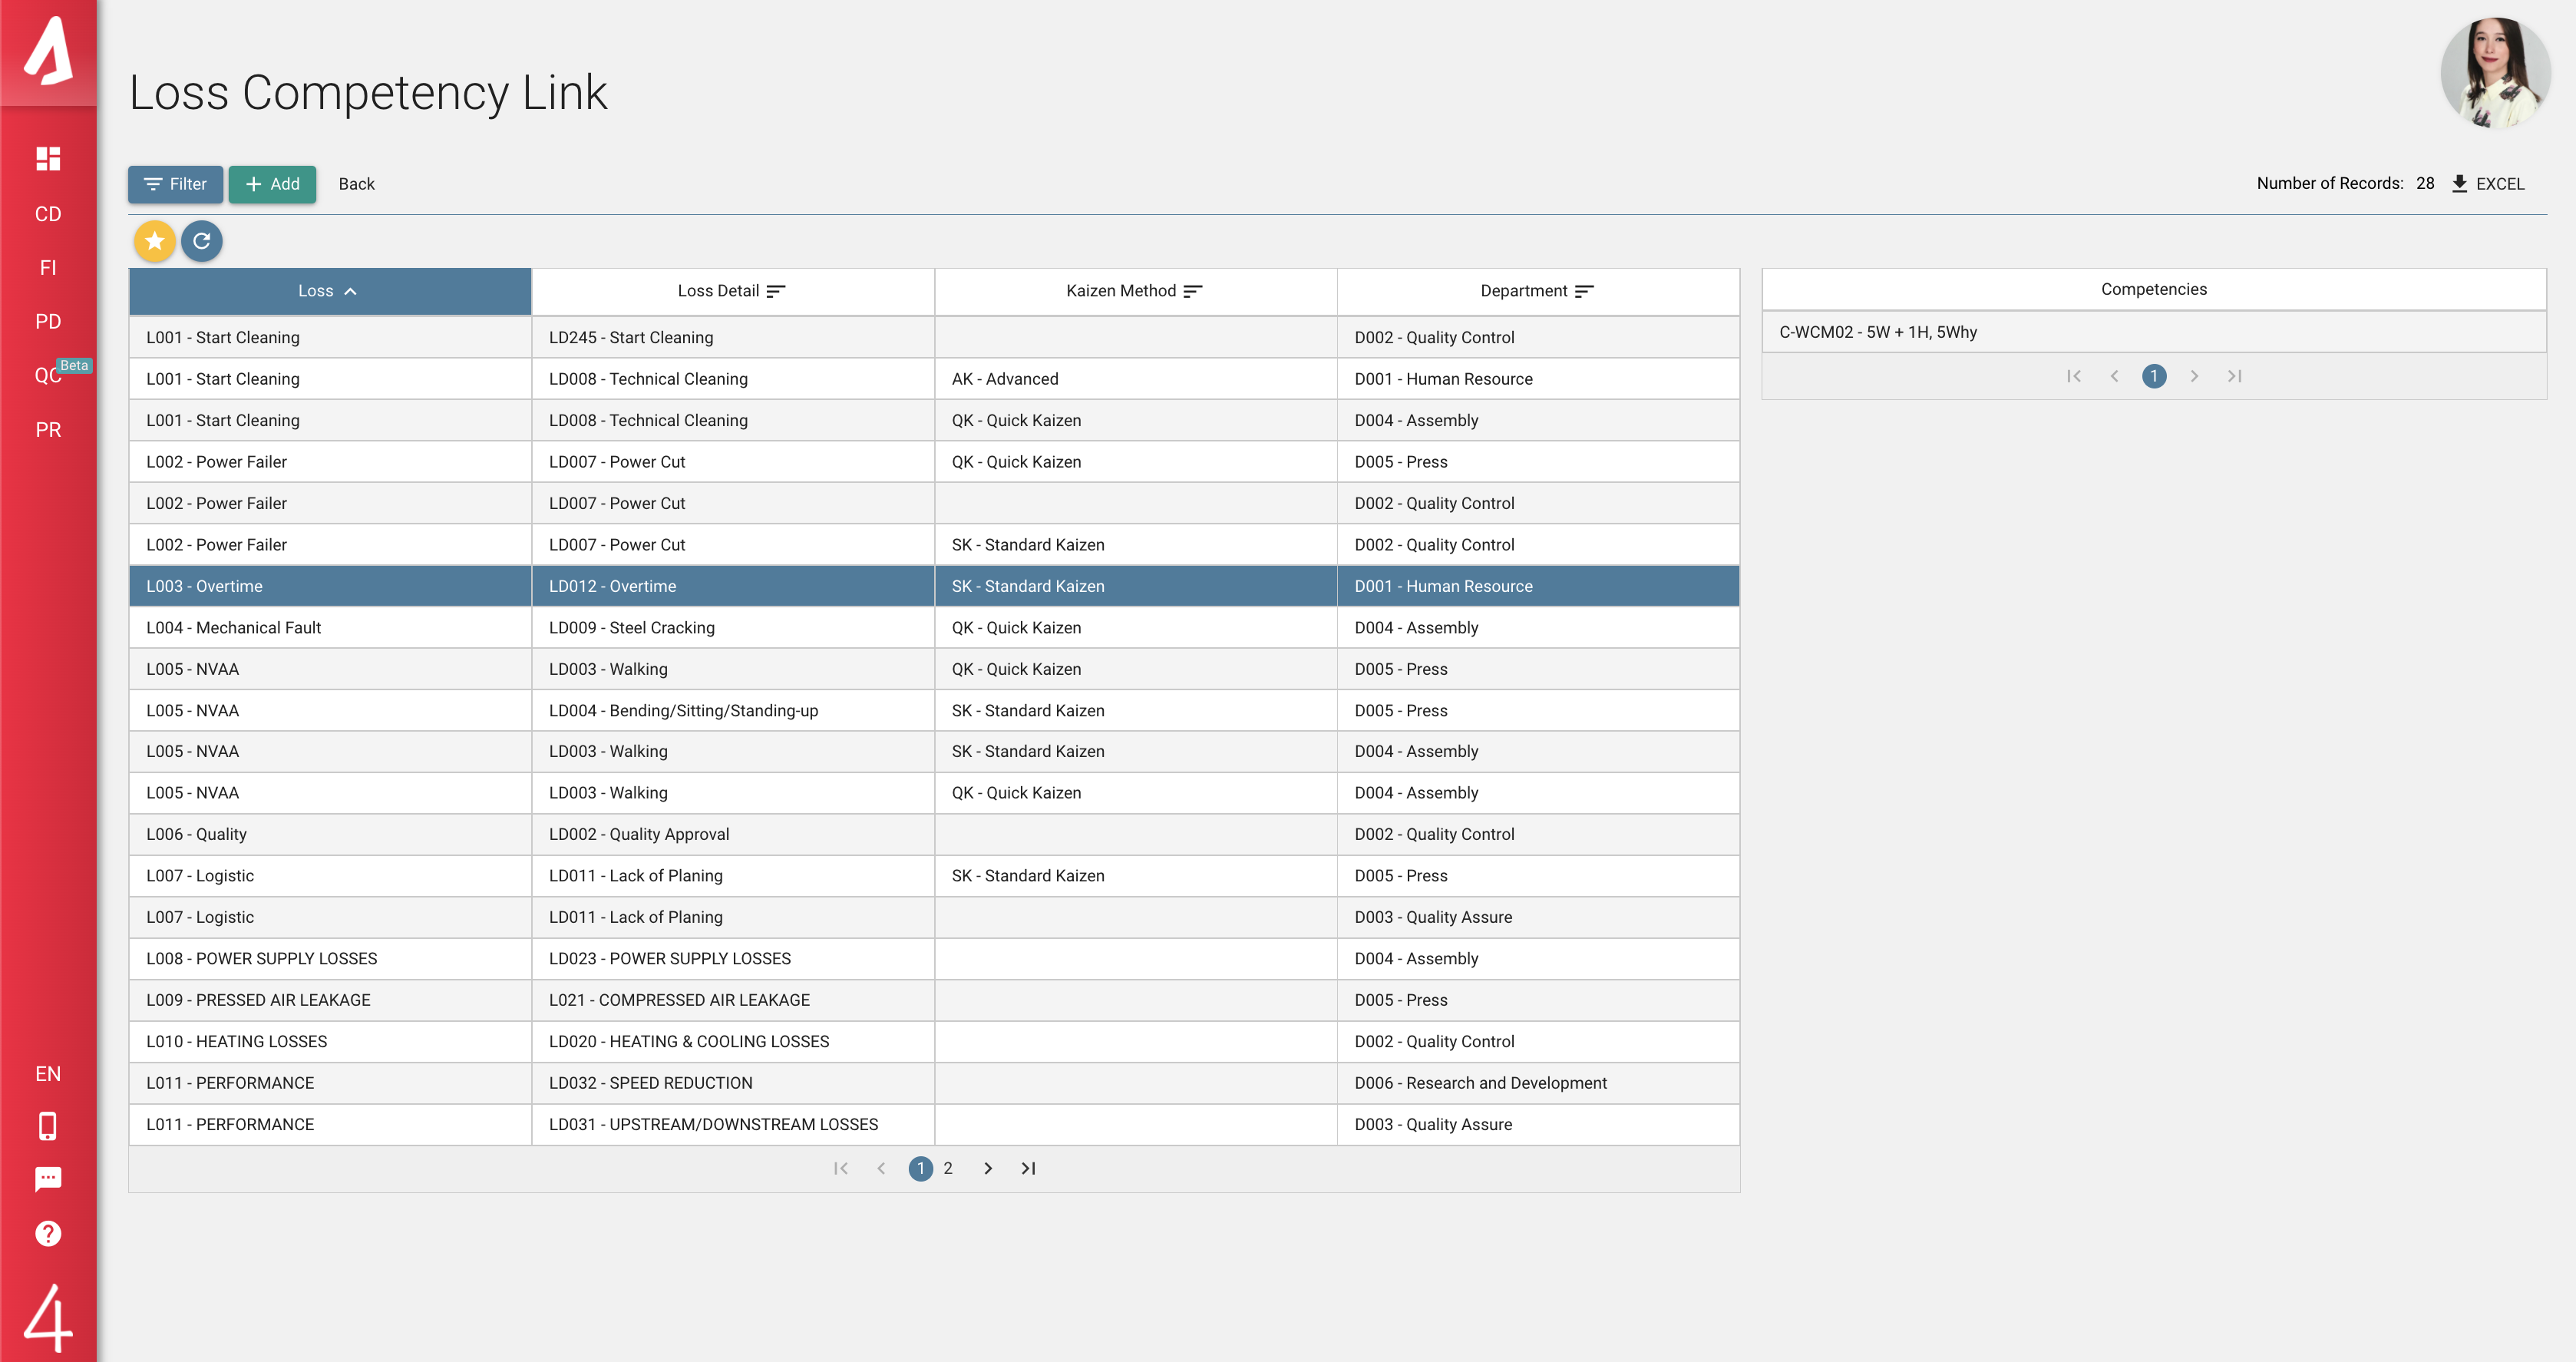
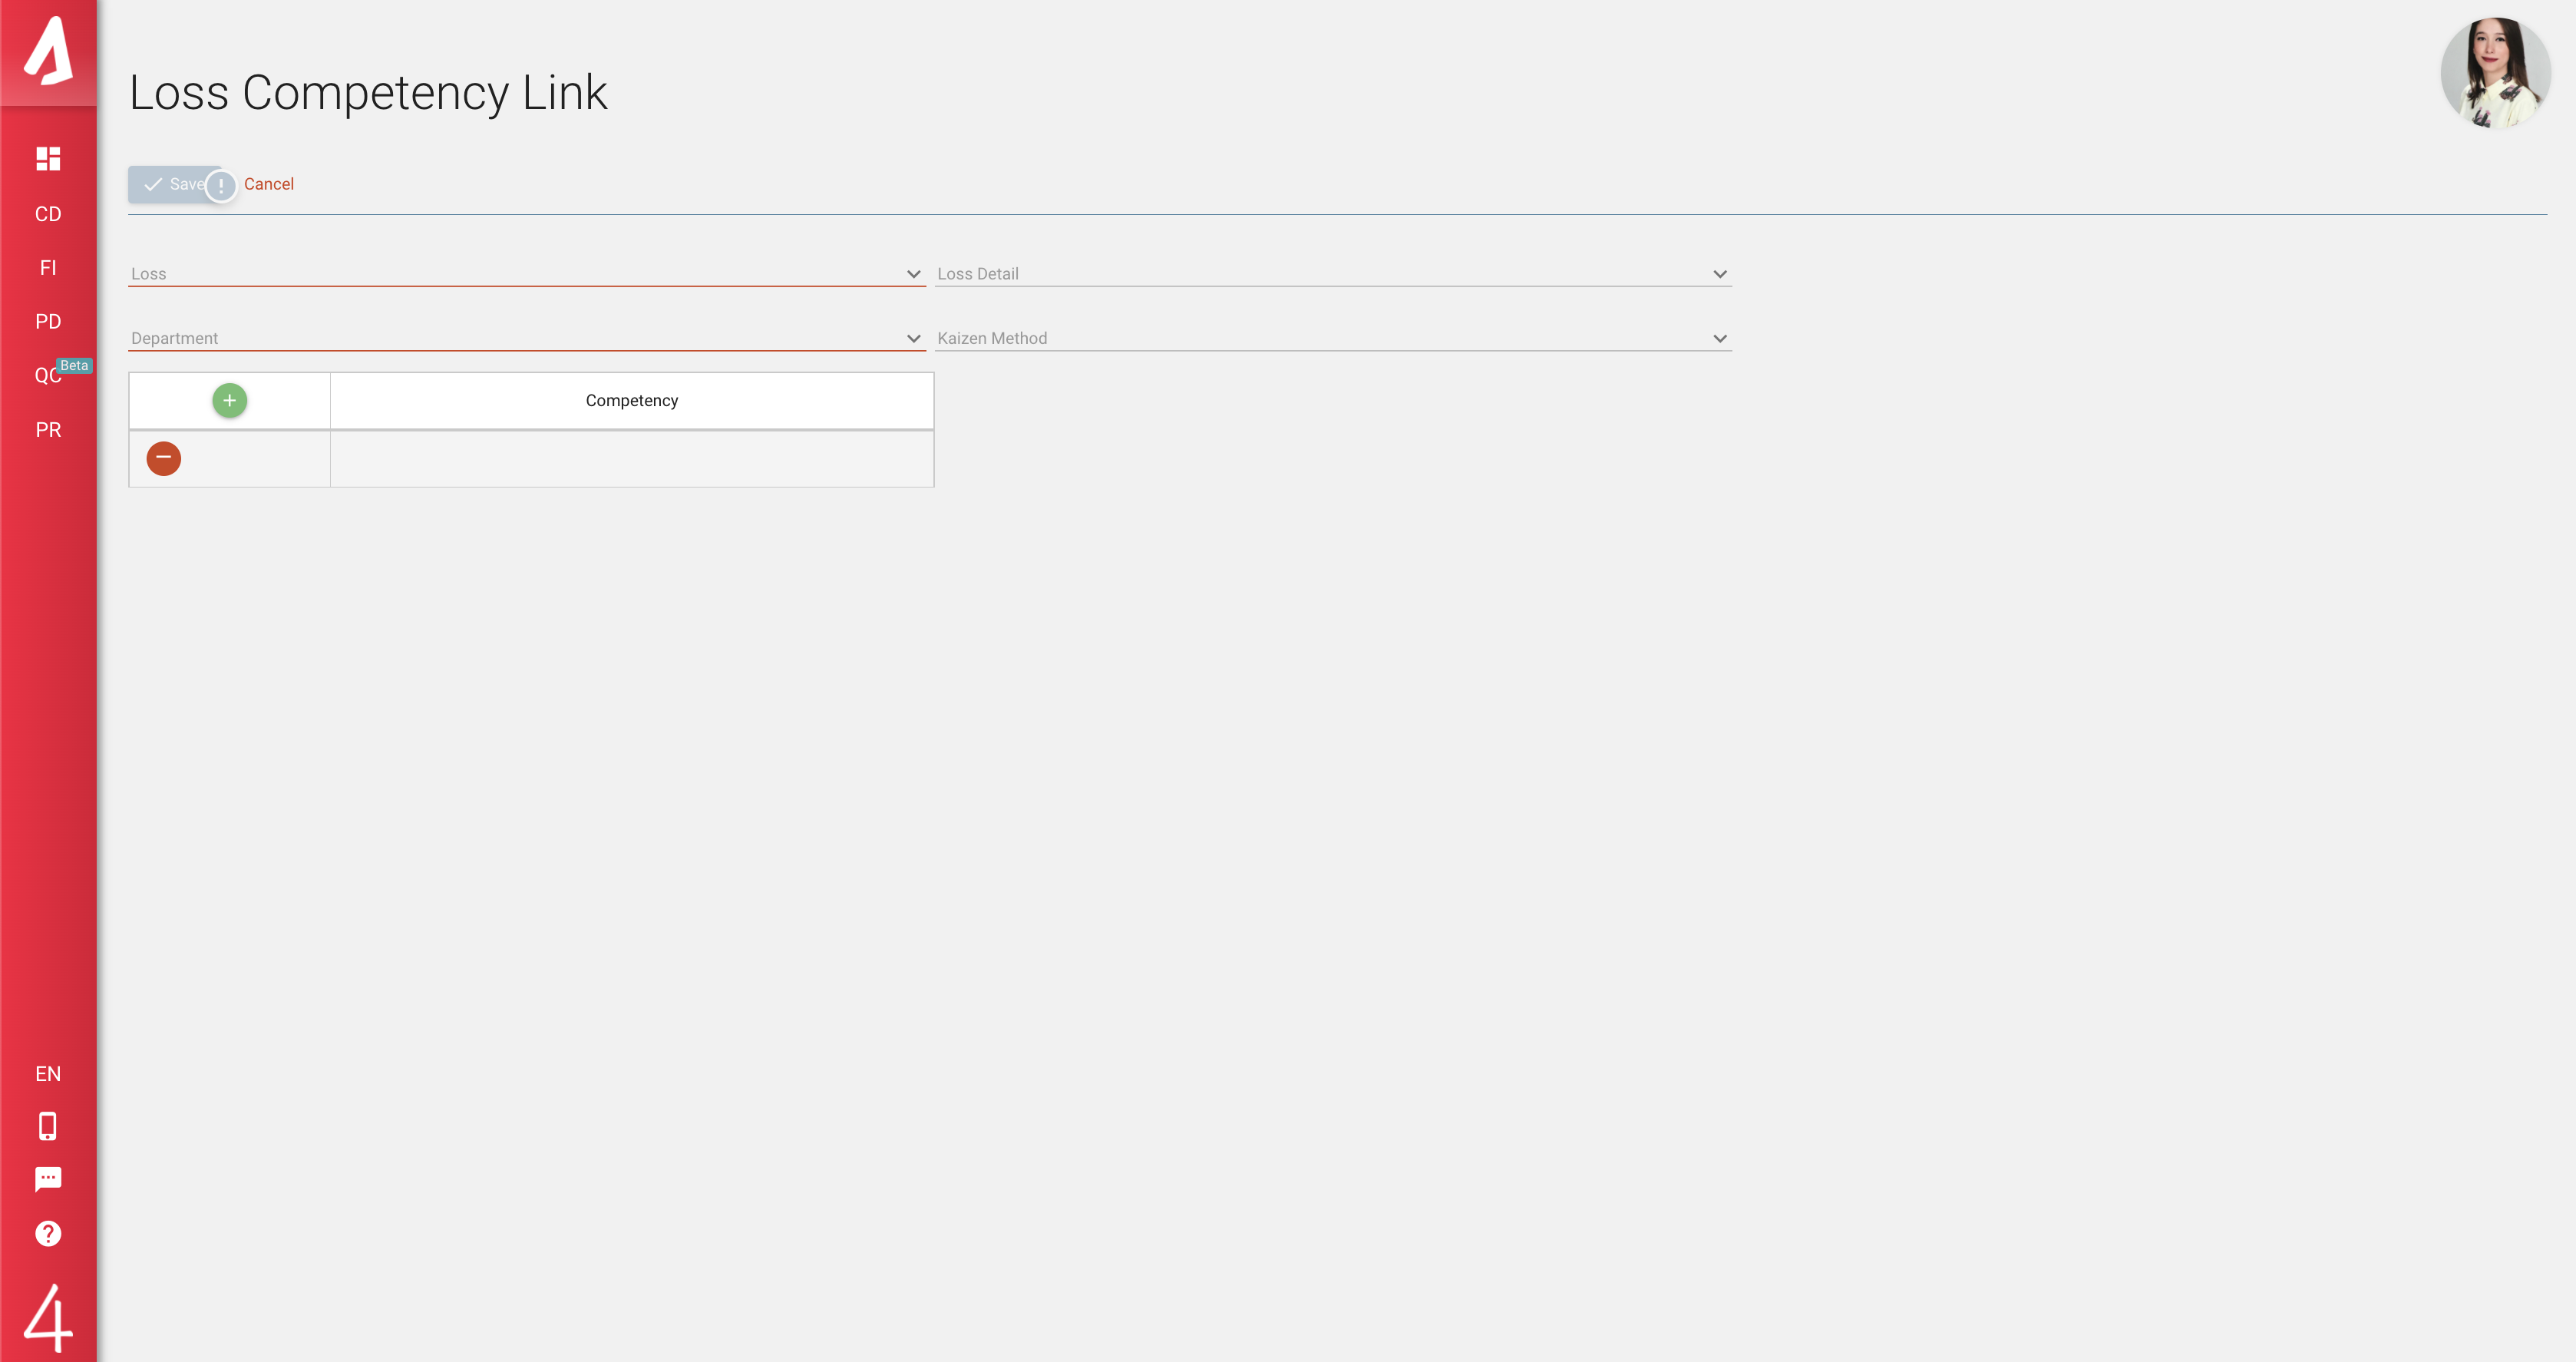
To create a new loss-competency link, use the Add button, and fill in the required information to define a loss. When you completed creating a loss, select a competency from the section below. You can add a competency and select a certain competency from the drop-down list. When you are finished, click Save and return to the main page.
