E Matrix
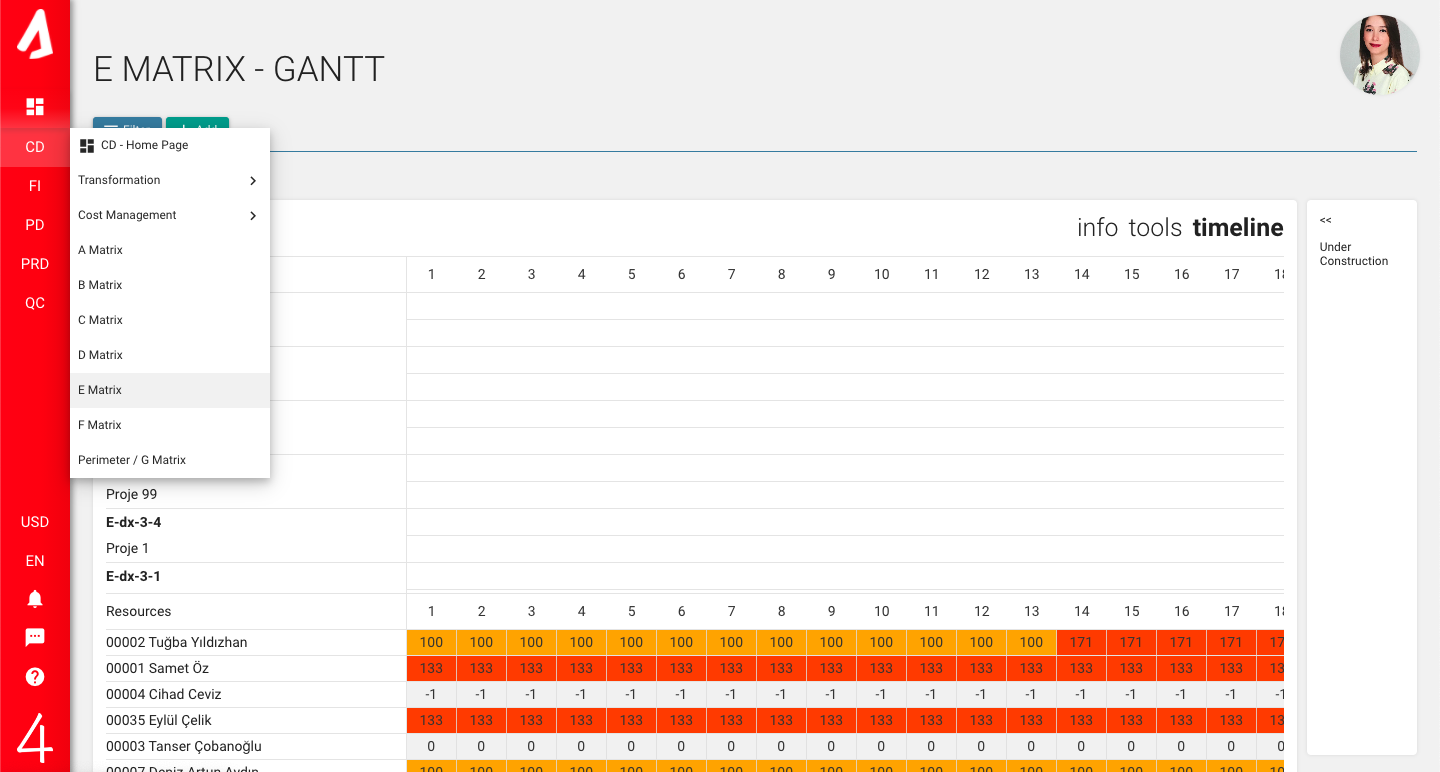
From the pillar options on the left, go to the CD-E Matrix section.
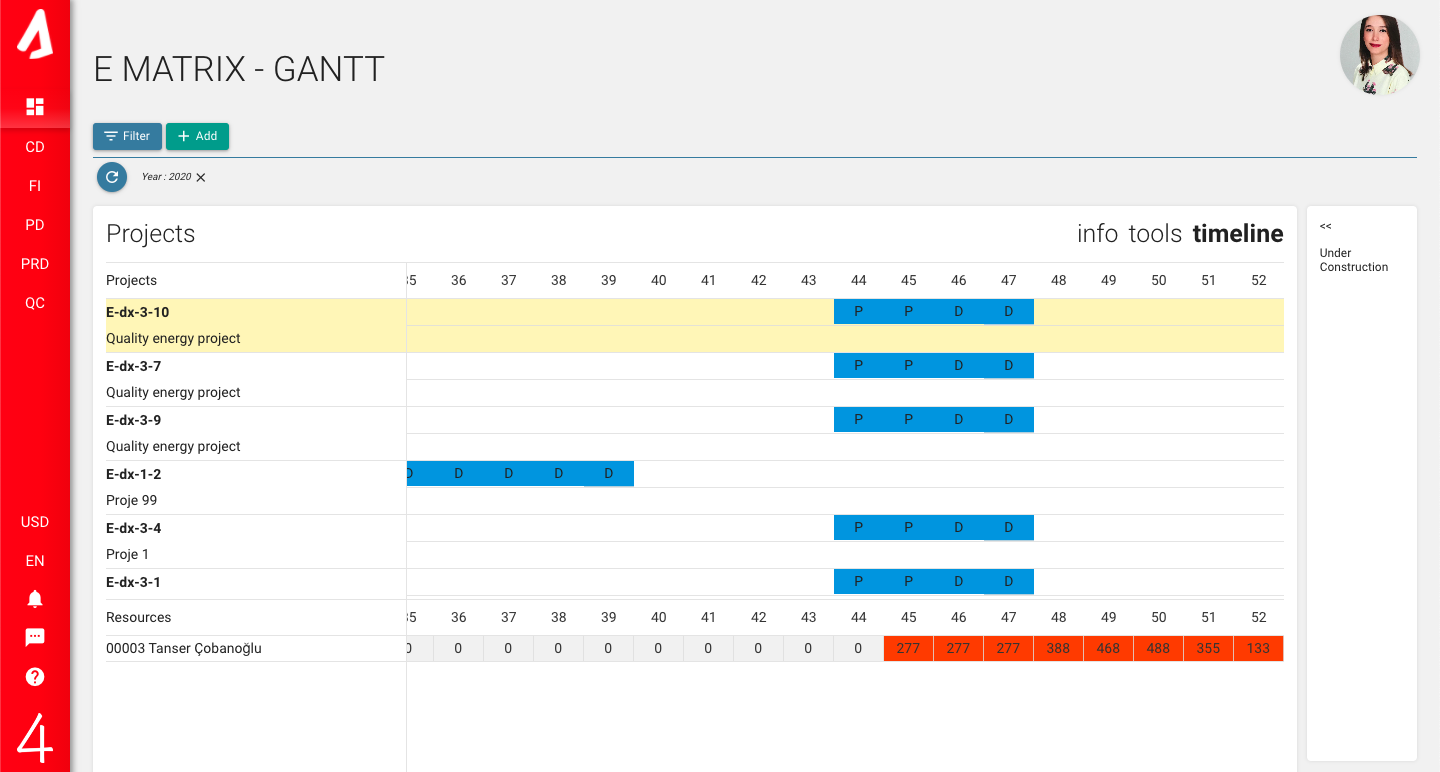
Projects were selected from matrix D transferred here. You can view the transferred projects in the Gantt Chart on this screen, specify and change the realization date. When the project bar is clicked on the Gantt chart, the detail screen of the project opens.
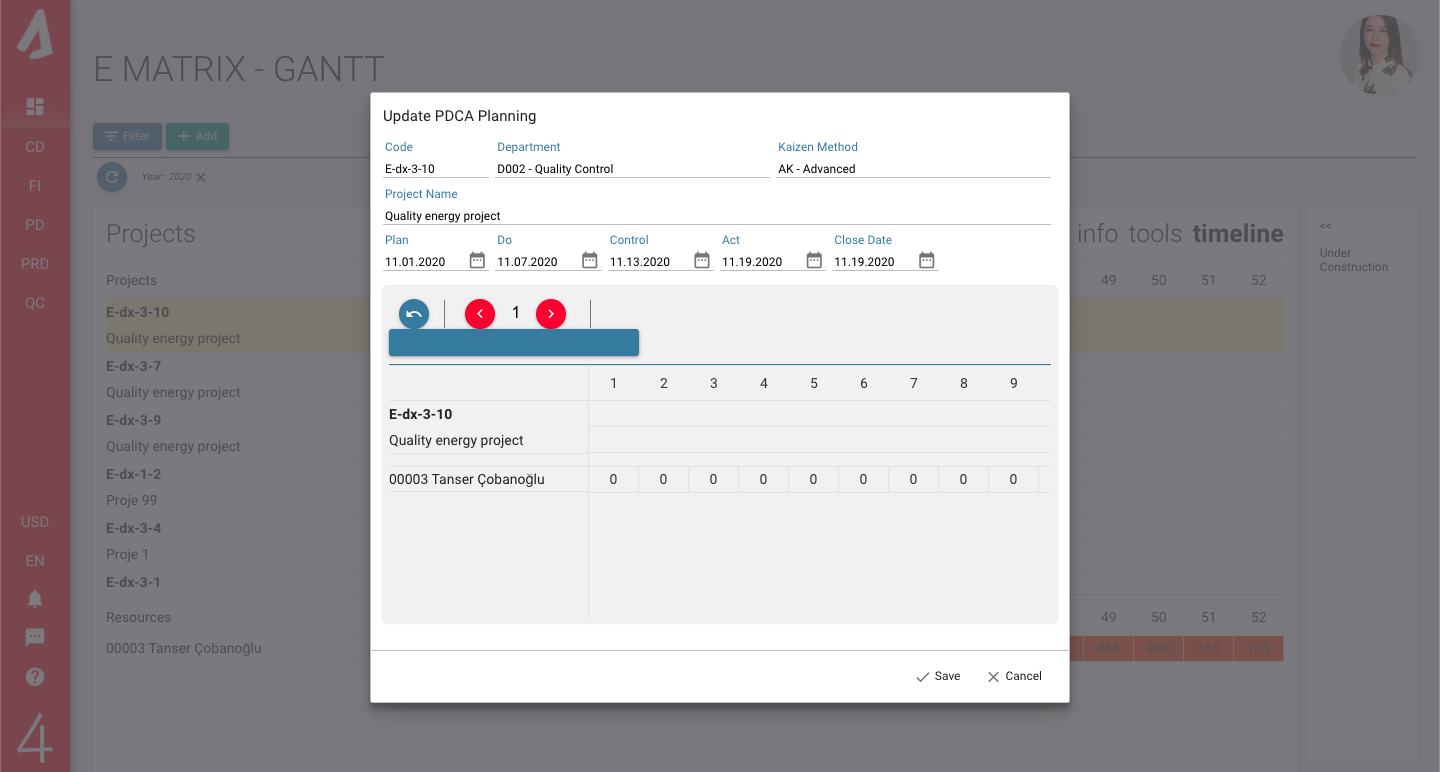
You can edit the project date from this page that opens.
Under the gantt chart, you can see the personnel involved in the project and their workload. Here are the cells colored green; It indicates that a project is planned at a level that the personnel can realize according to the engineering level (full occupancy). Red color representations; Project planning above the engineering level (over occupancy). Thanks to this screen, you can easily set the best time for your project according to the availability of your personnel.
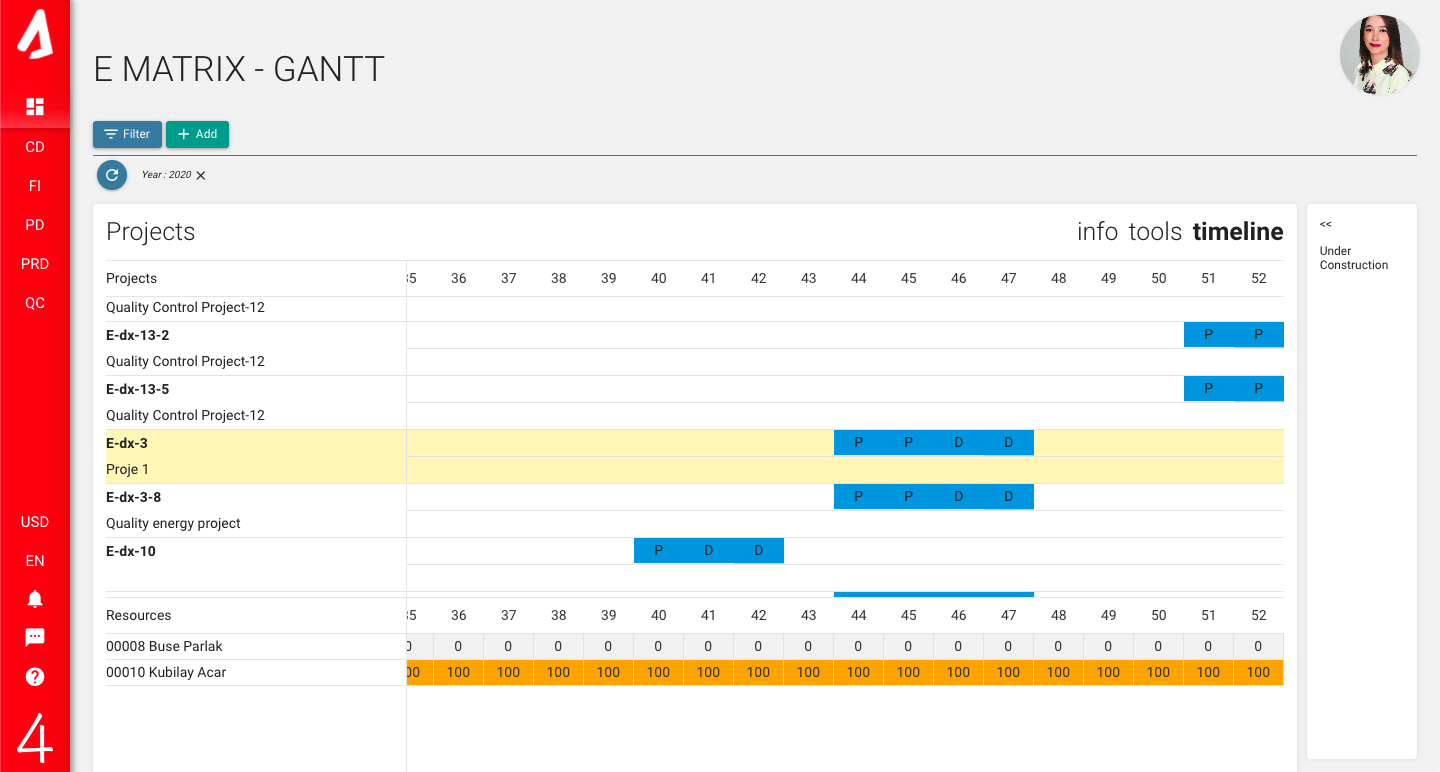
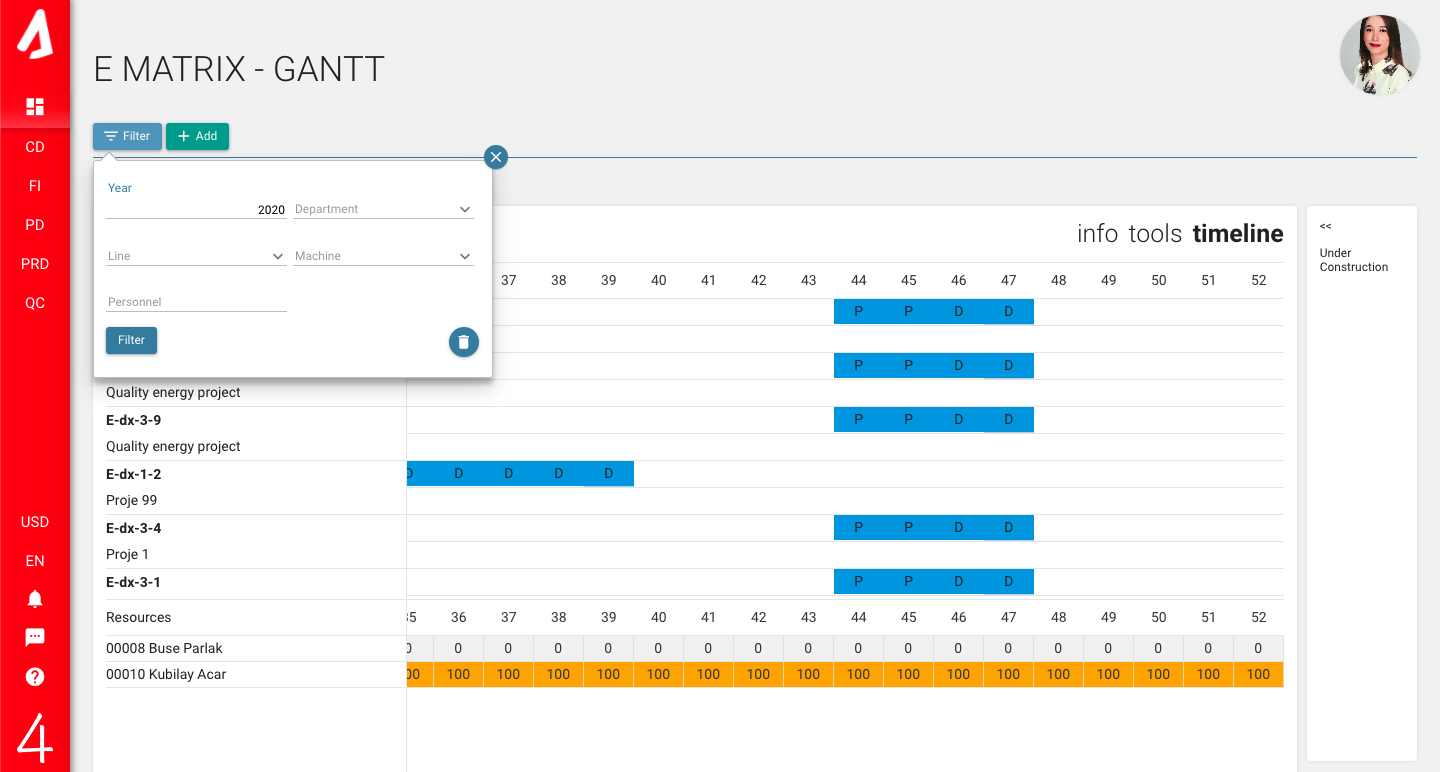
With the ‘Filter’ on the top left, you can filter the list of projects according to the criteria you want.
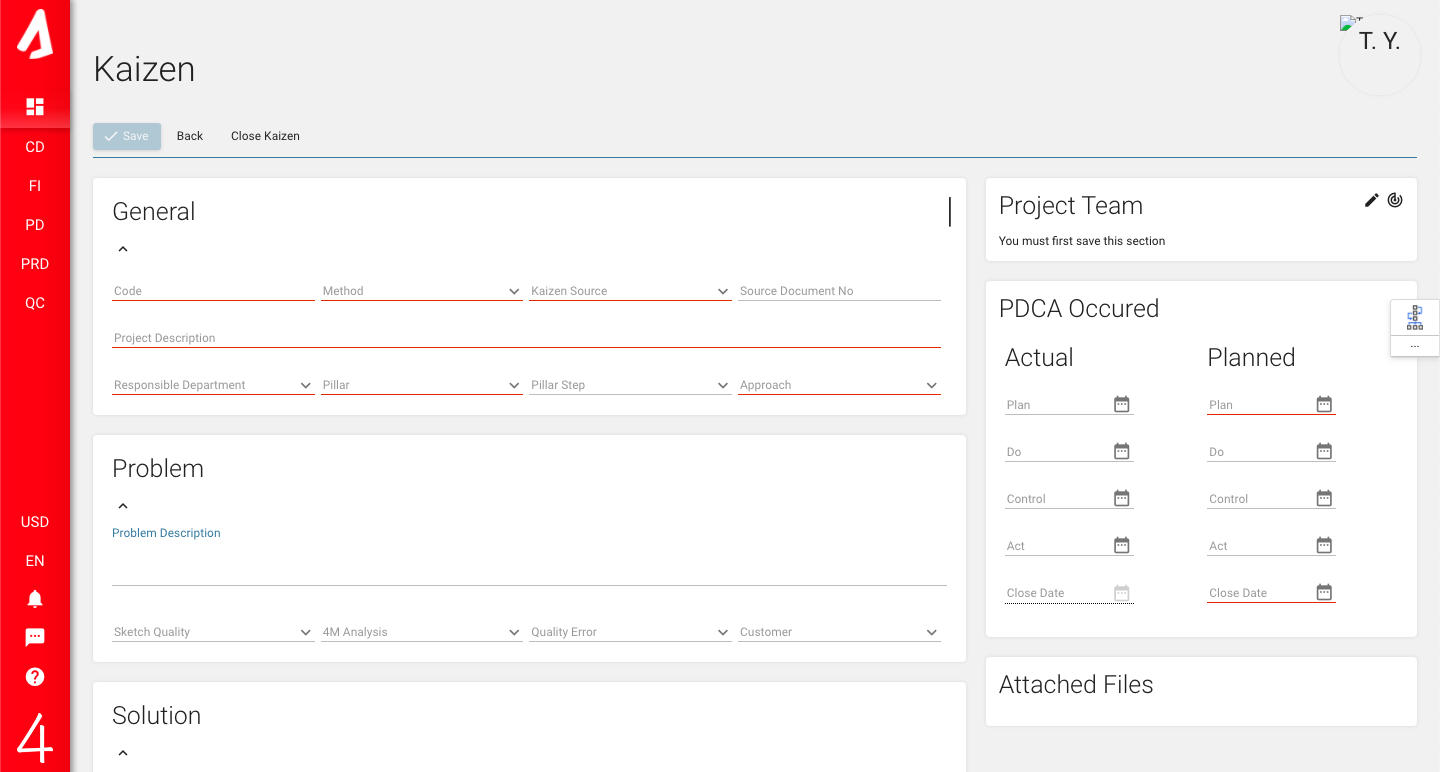
New projects can be created here, except projects transferred from the D matrix. You can add a new kaizen by pressing the ‘add’ button at the top left. The areas underlined in red are mandatory.
