Worload Analysis
Workload Analysis
From the pillar options on the left, go to the FI Module- Workload Analysis section.
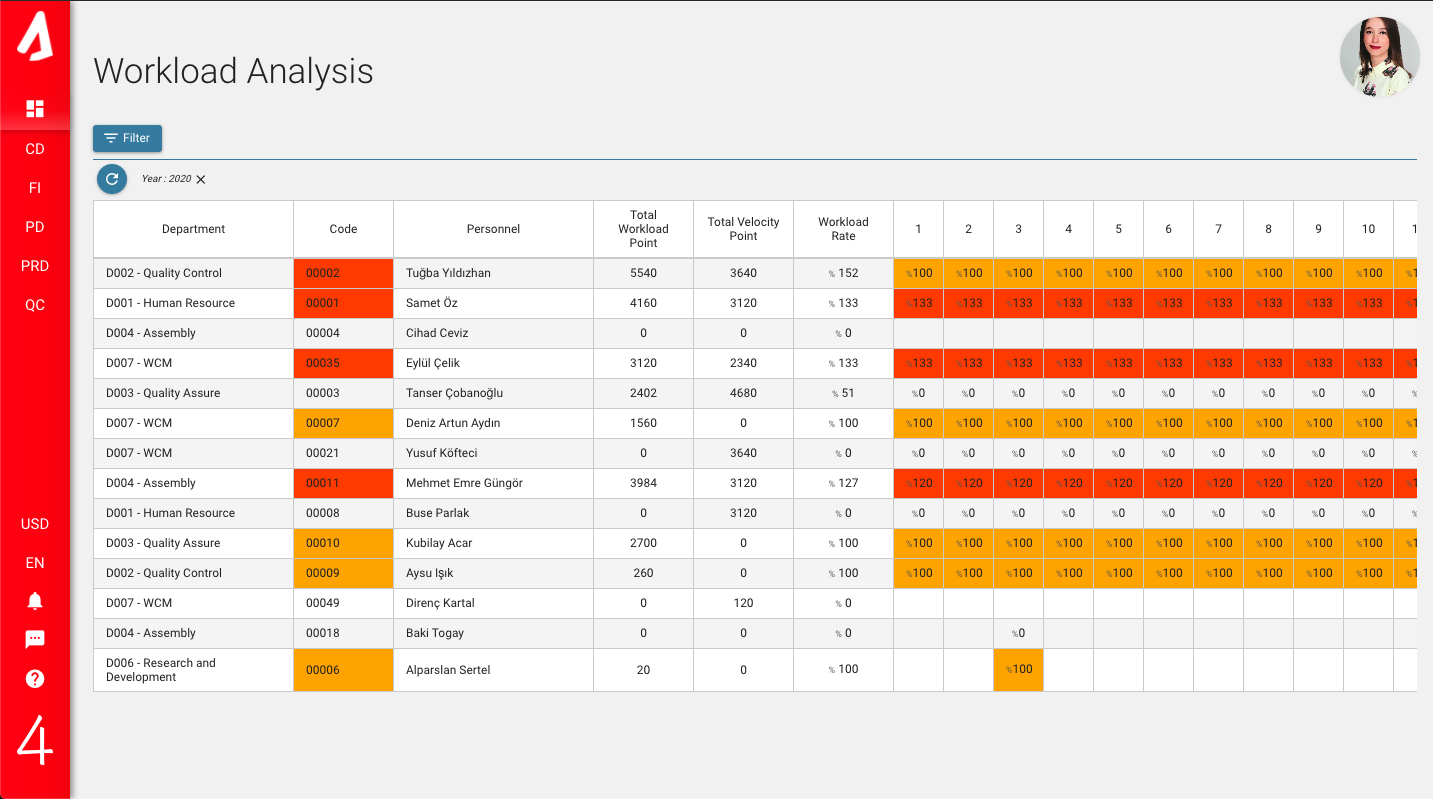
You can see the weekly workloads of the personnel on this screen.

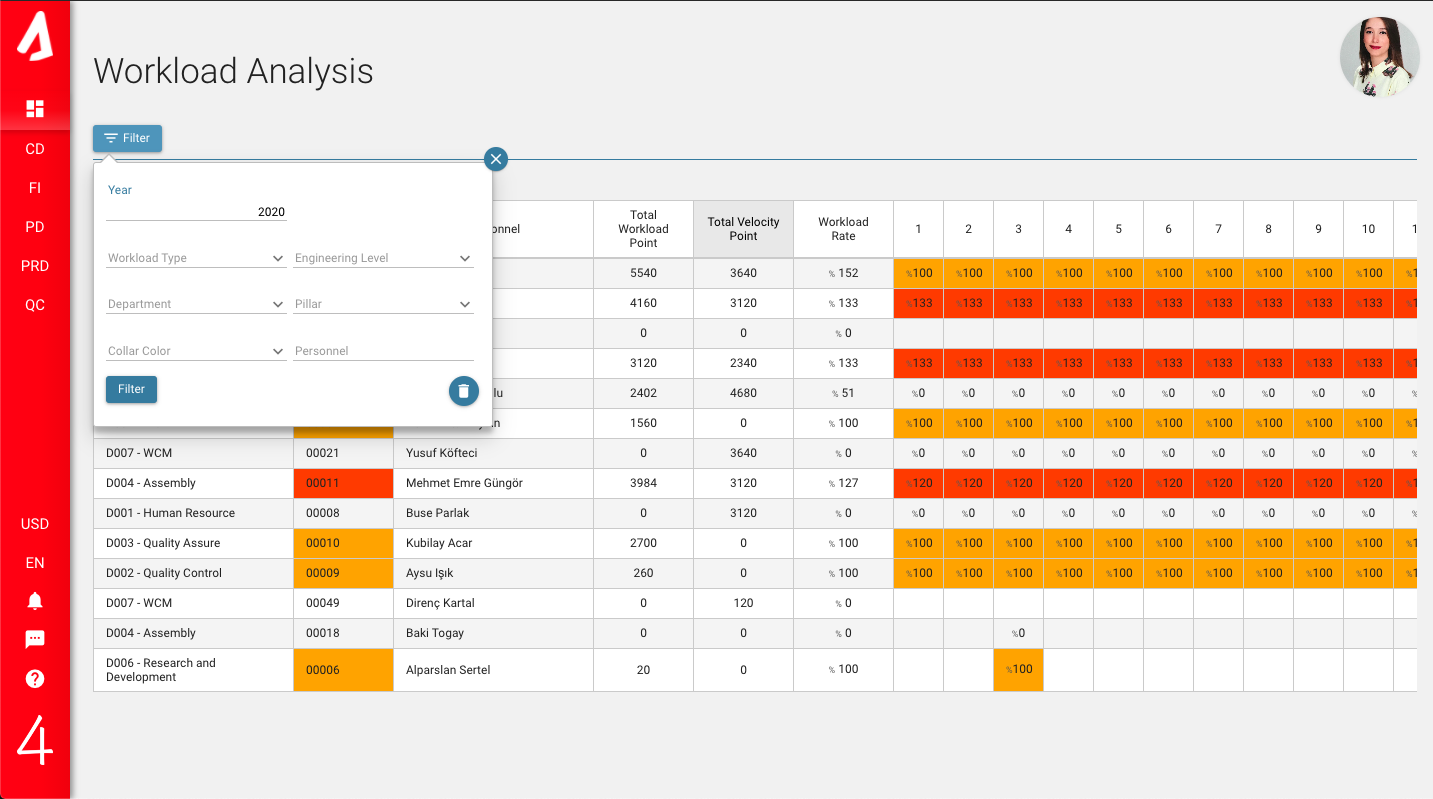
You can create workload analysis according to the filter you choose using the filter on the top left.

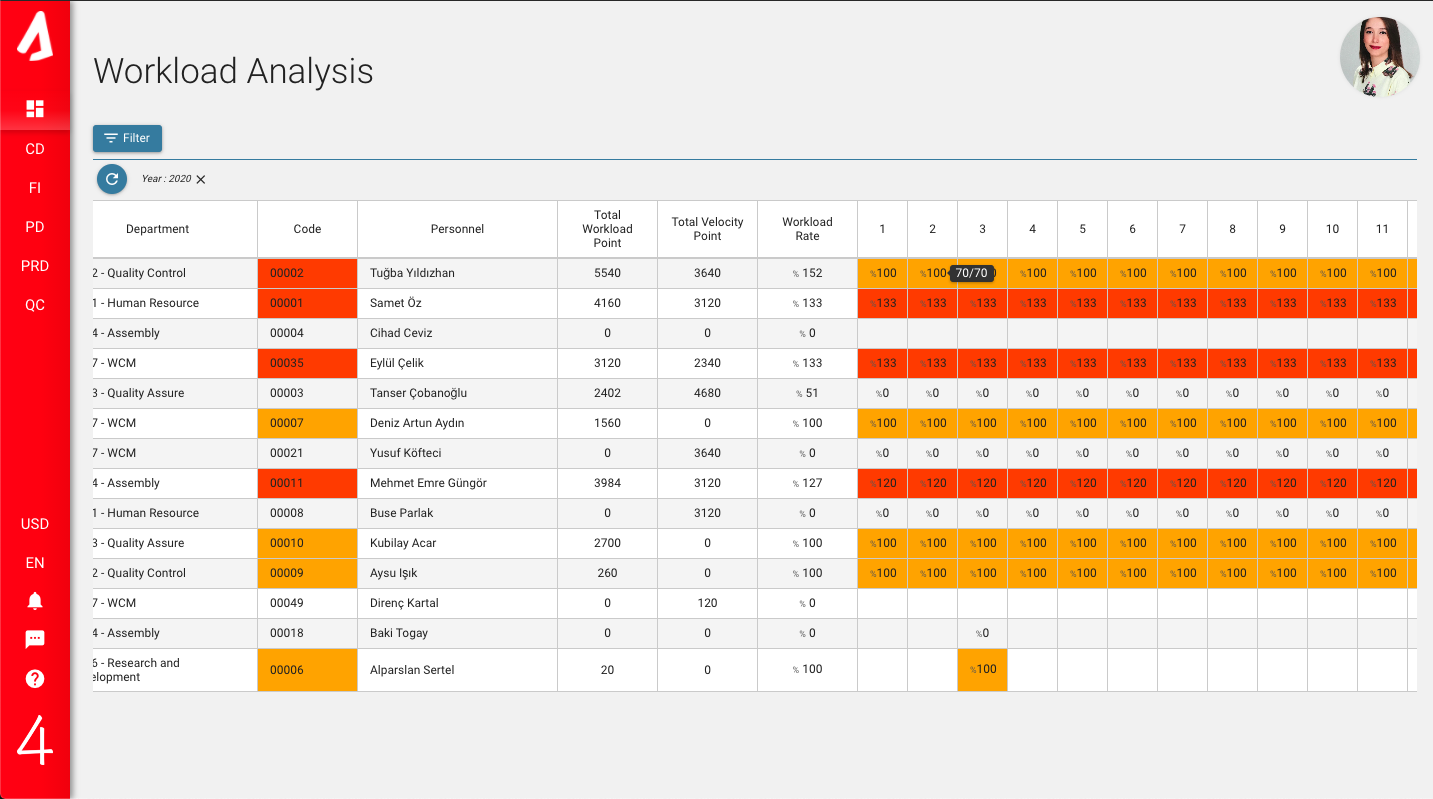
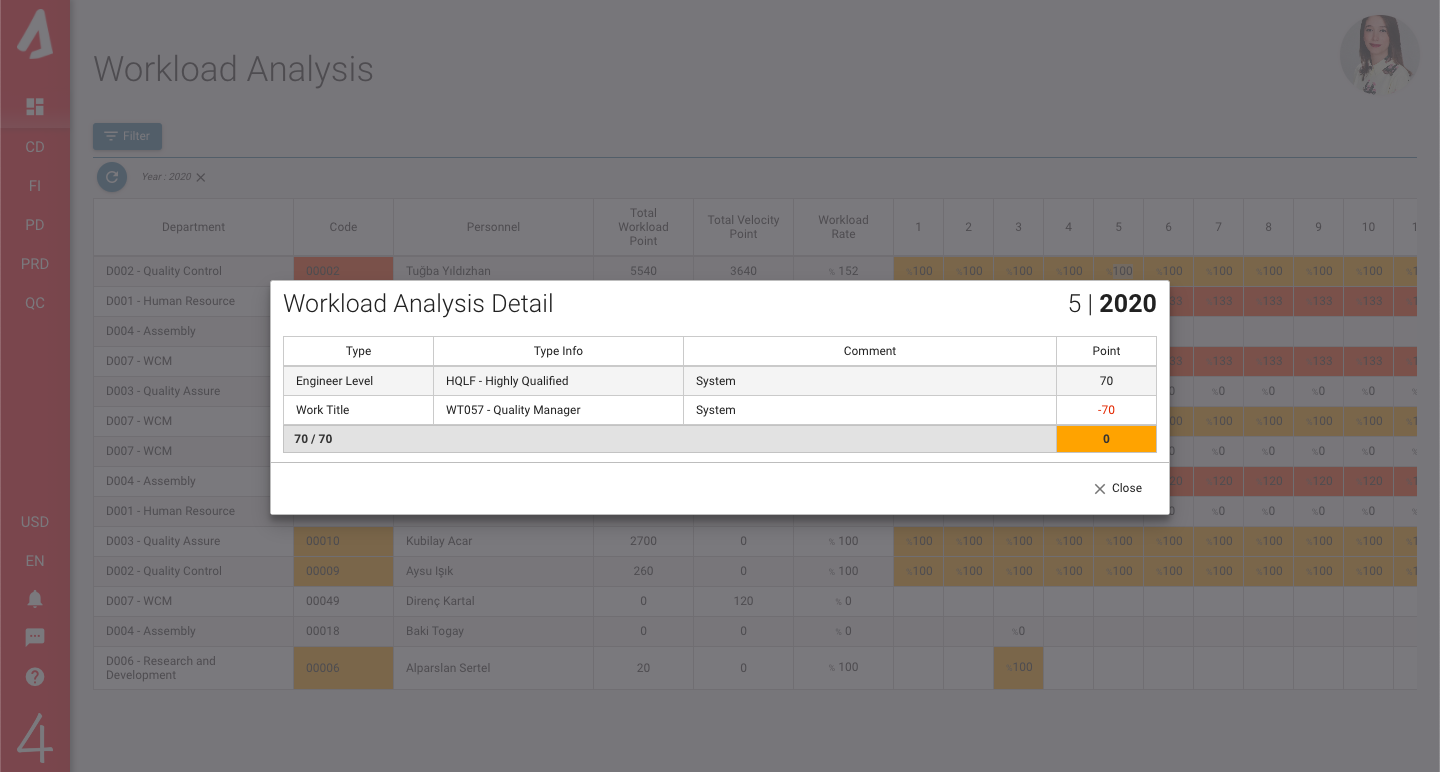
When you hover over the relevant workload in the table, you can see the detailed information.The value you see here is the Workload Point / Velocity value.If you double click here, the detail screen opens.You can see where these values come from on the detail screen.The engineering level determines the capacity of the personnel. Worktitle, project or kaizen affect capacity ‘-‘ directionally. For example, the personnel’s capacity is 80, and a workload is 30. In the current situation, the capacity to do work is reduced to (80-30) = 50.


With the coloring feature according to the workload in the table, you can easily see which personnel is available and which is not for the kaizens and projects.